This the multi-page printable view of this section. Click here to print.
Documentation
- 1: Installation
- 1.1: Quick Start
- 1.2: Installation Guide
- 1.2.1: Prerequisites
- 1.2.2: Install via Helm
- 1.2.3: Install via OperatorHub
- 1.2.4: The Kiali CR
- 1.2.5: Accessing Kiali
- 1.2.6: Advanced Install
- 1.2.7: Example Install
- 1.3: Deployment Options
- 2: Configuration
- 2.1: Authentication Strategies
- 2.1.1: Anonymous strategy
- 2.1.2: Header strategy
- 2.1.3: OpenID Connect strategy
- 2.1.4: OpenShift strategy
- 2.1.5: Token strategy
- 2.1.6: Session options
- 2.2: Console Customization
- 2.3: Custom Dashboards
- 2.4: Istio Environment
- 2.5: Kiali CR Reference
- 2.6: Namespace Management
- 2.7: Prometheus, Jaeger, Grafana
- 2.7.1: Grafana
- 2.7.2: Jaeger
- 2.7.3: Prometheus
- 2.8: Role-based access control
- 2.9: Traffic Health
- 2.10: Virtual Machine workloads
- 3: Features
- 3.1: Application Wizards
- 3.2: Detail Views
- 3.3: Health
- 3.4: Istio Configuration
- 3.5: Istio Infrastructure Status
- 3.6: Multi-cluster Deployment
- 3.7: Security
- 3.8: Topology
- 3.9: Tracing
- 3.10: Validation
- 4: Tutorials
- 4.1: Travel Demo Tutorial
- 4.1.1: Prerequisites
- 4.1.2: Install Travel Demo
- 4.1.3: First Steps
- 4.1.4: Observe
- 4.1.5: Connect
- 4.1.6: Secure
- 4.1.7: Uninstall Travel Demo
- 5: Architecture and Terms
- 5.1: Architecture
- 5.2: Terminology
- 5.2.1: Concepts
- 5.2.2: Networking
- 6: FAQ
- 6.1: Authentication
- 6.2: Distributed Tracing
- 6.3: General
- 6.4: Graph
- 6.5: Installation
- 6.6: Istio Component Status
- 6.7: Validations
- 7: Contribution Guidelines
- 7.1: How to Contribute
- 7.2: Development Environment
1 - Installation
1.1 - Quick Start
You can quickly install and try Kiali via one of the following two methods.
Install via Istio Addons
If you downloaded Istio, the easiest way to install and try Kiali is by running:
kubectl apply -f ${ISTIO_HOME}/samples/addons/kiali.yaml
To uninstall:
kubectl delete -f ${ISTIO_HOME}/samples/addons/kiali.yaml --ignore-not-found
Install via Helm
To install the latest version of Kiali Server using Helm, run the following command:
helm install \
  --namespace istio-system \
  --set auth.strategy="anonymous" \
  --repo https://kiali.org/helm-charts \
  kiali-server \
  kiali-server
--disable-openapi-validation (this is needed on some versions of OpenShift, for example).
To uninstall:
helm uninstall --namespace istio-system kiali-server
Access to the UI
Run the following command:
kubectl port-forward svc/kiali 20001:20001 -n istio-system
Then, access Kiali by visiting \https://localhost:20001/ in your preferred web browser.
1.2 - Installation Guide
This section describes the production installation methods available for Kiali.
The recommended way to deploy Kiali is via the Kiali Operator, either using Helm Charts or OperatorHub.
The Kiali Operator is a Kubernetes Operator and manages your Kiali installation. It watches the Kiali Custom Resource (Kiali CR), a YAML file that holds the deployment configuration.
1.2.1 - Prerequisites
Istio
Before you install Kiali you must have already installed Istio along with its telemetry storage addon (i.e. Prometheus). You might also consider installing Istio’s optional tracing addon (i.e. Jaeger) and optional Grafana addon but those are not required by Kiali. Refer to the Istio documentation for details.
Enable the Debug Interface
Like istioctl, Kiali makes use of Istio’s port 8080 “Debug Interface”. Despite the naming, this is required for accessing the status of the proxies
and the Istio registry.
The ENABLE_DEBUG_ON_HTTP setting controls the relevant access. Istio suggests to disable this for security, but Kiali requires ENABLE_DEBUG_ON_HTTP=true,
which is the default.
For more information, see the Istio documentation.
Version Compatibility
Each Kiali release is tested against the most recent Istio release. In general, Kiali tries to maintain compatibility with older Istio releases and Kiali versions later than those posted in the below table may work, but such combinations are not tested and will not be supported. Known incompatibilities are noted in the compatibility table below.
Istio |
Kiali |
Notes |
|---|---|---|
| 1.15 | 1.55.1 or later | |
| 1.14 | 1.50.0 to 1.54.x | |
| 1.13 | 1.45.1 to 1.49.x | |
| 1.12 | 1.42.0 to 1.44.x | Istio 1.12 is out of support. |
| 1.11 | 1.38.1 to 1.41.x | Istio 1.11 is out of support. |
| 1.10 | 1.34.1 to 1.37.x | Istio 1.10 is out of support. |
| 1.9 | 1.29.1 to 1.33.x | Istio 1.9 is out of support. |
| 1.8 | 1.26.0 to 1.28.x | Istio 1.8 removes all support for mixer/telemetry V1, as does Kiali 1.26.0. Use earlier versions of Kiali for mixer support. |
| 1.7 | 1.22.1 to 1.25.x | Istio 1.7 istioctl will no longer install Kiali. Use the Istio samples/addons all-in-one yaml or the Kiali Helm Chart for quick demo installs. Istio 1.7 is out of support. |
| 1.6 | 1.18.1 to 1.21.x | Istio 1.6 introduces CRD and Config changes, Kiali 1.17 is recommended for Istio < 1.6. |
Maistra Version Compatibility
Maistra |
SMCP CR |
Kiali |
Notes |
|---|---|---|---|
| 2.2 | 2.2 | 1.48 | Using Maistra 2.2 to install service mesh control plane 2.2 requires Kiali Operator v1.48. Other operator versions are not compatible. |
| 2.2 | 2.1 | 1.36 | Using Maistra 2.2 to install service mesh control plane 2.1 requires Kiali Operator v1.48. Other operator versions are not compatible. |
| 2.2 | 2.0 | 1.24 | Using Maistra 2.2 to install service mesh control plane 2.0 requires Kiali Operator v1.48. Other operator versions are not compatible. |
| 2.1 | 2.1 | 1.36 | Using Maistra 2.1 to install service mesh control plane 2.1 requires Kiali Operator v1.36. Other operator versions are not compatible. |
| 2.1 | 2.0 | 1.24 | Using Maistra 2.1 to install service mesh control plane 2.0 requires Kiali Operator v1.36. Other operator versions are not compatible. |
| 2.1 | 1.1 | 1.12 | Using Maistra 2.1 to install service mesh control plane 1.1 requires Kiali Operator v1.36. Other operator versions are not compatible. |
| 2.0 | 2.0 | 1.24 | Using Maistra 2.0 to install service mesh control plane 2.0 requires Kiali Operator v1.36. Other operator versions are not compatible. |
| 2.0 | 1.1 | 1.12 | Using Maistra 2.0 to install service mesh control plane 1.1 requires Kiali Operator v1.36. Other operator versions are not compatible. |
| 1.1 | 1.1 | 1.12 | Using Maistra 1.1 to install service mesh control plane 1.1 requires Kiali Operator v1.36. Other operator versions are not compatible. |
| n/a | 1.0 | n/a | Service mesh control plane 1.0 is out of support. |
OpenShift Service Mesh Version Compatibility
OpenShift
If you are running Red Hat OpenShift Service Mesh (RH OSSM), use only the bundled version of Kiali.OSSM |
Kiali |
Notes |
|---|---|---|
| 2.2 | 1.48 | |
| 2.1 | 1.36 | |
| 2.0 | 1.24 | |
| 1.1 | 1.12 |
Browser Compatibility
Kiali requires a modern web browser and supports the last two versions of Chrome, Firefox, Safari or Edge.
Hardware Requirements
Any machine capable of running a Kubernetes based cluster should also be able to run Kiali.
However, Kiali tends to grow in resource usage as your cluster grows. Usually the more namespaces and workloads you have in your cluster, the more memory you will need to allocate to Kiali.
Platform-specific requirements
OpenShift
If you are installing on OpenShift, you must grant the cluster-admin role to the user that is installing Kiali. If OpenShift is installed locally on the machine you are using, the following command should log you in as user system:admin which has this cluster-admin role:
$ oc login -u system:admin
kubectl is used to interact with the cluster environment. On OpenShift you can simply replace kubectl with oc, unless otherwise noted.
Google Cloud Private Cluster
Private clusters on Google Cloud have network restrictions. Kiali needs your cluster’s firewall to allow access from the Kubernetes API to the Istio Control Plane namespace, for both the 8080 and 15000 ports.
To review the master access firewall rule:
gcloud compute firewall-rules list --filter="name~gke-${CLUSTER_NAME}-[0-9a-z]*-master"
To replace the existing rule and allow master access:
gcloud compute firewall-rules update <firewall-rule-name> --allow <previous-ports>,tcp:8080,tcp:15000
1.2.2 - Install via Helm
Introduction
Helm is a popular tool that lets you manage Kubernetes applications. Applications are defined in a package named Helm chart, which contains all of the resources needed to run an application.
Kiali has a Helm Charts Repository at https://kiali.org/helm-charts. Two Helm Charts are provided:
- The
kiali-operatorHelm Chart installs the Kiali operator which in turn installs Kiali when you create a Kiali CR. - The
kiali-serverHelm Chart installs a standalone Kiali without the need of the Operator nor a Kiali CR.
kiali-server Helm Chart does not provide all the functionality that the Operator
provides. Some features you read about in the documentation may only be available if
you install Kiali using the Operator. Therefore, although the kiali-server Helm Chart
is actively maintained, it is not recommended and is only provided for convenience.
If using Helm, the recommended method is to install the kiali-operator Helm Chart
and then create a Kiali CR to let the Operator deploy Kiali.
Make sure you have the helm command available by following the
Helm installation docs.
Adding the Kiali Helm Charts repository
Add the Kiali Helm Charts repository with the following command:
$ helm repo add kiali https://kiali.org/helm-charts
helm commands in this page assume that you added the Kiali Helm Charts repository as shown.
If you already added the repository, you may want to update your local cache to fetch latest definitions by running:
$ helm repo update
Installing Kiali using the Kiali operator
Once you’ve added the Kiali Helm Charts repository, you can install the latest Kiali Operator along with the latest Kiali server by running the following command:
$ helm install \
    --set cr.create=true \
    --set cr.namespace=istio-system \
    --namespace kiali-operator \
    --create-namespace \
    kiali-operator \
    kiali/kiali-operator
The --namespace kiali-operator and --create-namespace flags instructs to
create the kiali-operator namespace (if needed), and deploy the Kiali
operator on it. The --set cr.create=true and --set cr.namespace=istio-system flags instructs to create a Kiali CR in the
istio-system namespace. Since the Kiali CR is created in advance, as soon as
the Kiali operator starts, it will process it to deploy Kiali.
The Kiali Operator Helm Chart is configurable. Check available options and default values by running:
$ helm show values kiali/kiali-operator
--version X.Y.Z flag to the helm install and helm show values commands to work with a specific version of Kiali.
The kiali-operator Helm Chart mirrors all settings of the Kiali CR as chart
values that you can configure using regular --set flags. For example, the
Kiali CR has a spec.namespace setting which you can configure in the
kiali-operator Helm Chart by passing the --set cr.namespace flag as
shown in the previous helm install example.
For more information about the Kiali CR, see the Creating and updating the Kiali CR page.
Operator-Only Install
To install only the Kiali Operator, omit the --set cr.create and
--set cr.namespace flags of the helm command previously shown. For example:
$ helm install \
    --namespace kiali-operator \
    --create-namespace \
    kiali-operator \
    kiali/kiali-operator
This will omit creation of the Kiali CR, which you will need to create later to install Kiali Server. This option is good if you plan to do large customizations to the installation.
Installing Multiple Instances of Kiali
By installing a single Kiali operator in your cluster, you can install multiple instances of Kiali by simply creating multiple Kiali CRs. For example, if you have two Istio control planes in namespaces istio-system and istio-system2, you can create a Kiali CR in each of those namespaces to install a Kiali instance in each control plane.
If you wish to install multiple Kiali instances in the same namespace, or if you need the Kiali instance to have different resource names than the default of kiali, you can specify spec.deployment.instance_name in your Kiali CR. The value for that setting will be used to create a unique instance of Kiali using that instance name rather than the default kiali. One use-case for this is to be able to have unique Kiali service names across multiple Kiali instances in order to be able to use certain routers/load balancers that require unique service names.
spec.deployment.instance_name field is used for the Kiali resource names, including the Service name, you must ensure the value you assign this setting follows the Kubernetes DNS Label Name rules. If it does not, the operator will abort the installation. And note that because Kiali uses this as a prefix (it may append additional characters for some resource names) its length is limited to 40 characters.
Standalone Kiali installation
To install the Kiali Server without the operator, use the kiali-server Helm Chart:
$ helm install \
    --namespace istio-system \
    kiali-server \
    kiali/kiali-server
The kiali-server Helm Chart mirrors all settings of the Kiali CR as chart
values that you can configure using regular --set flags. For example, the
Kiali CR has a spec.server.web_fqdn setting which you can configure in the
kiali-server Helm Chart by passing the --set server.web_fqdn flag as
follows:
$ helm install \
    --namespace istio-system \
    --set server.web_fqdn=example.com \
    kiali-server \
    kiali/kiali-server
Upgrading Helm installations
If you want to upgrade to a newer Kiali version (or downgrade to older
versions), you can use the regular helm upgrade commands. For example, the
following command should upgrade the Kiali Operator to the latest version:
$ helm upgrade \
    --namespace kiali-operator \
    --reuse-values \
    kiali-operator \
    kiali/kiali-operator
WARNING: No migration paths are provided. However, Kiali is a stateless
application and if the helm upgrade command fails, please uninstall the
previous version and then install the new desired version.
Managing configuration of Helm installations
After installing either the kiali-operator or the kiali-server Helm Charts,
you may be tempted to manually modify the created resources to modify the
installation. However, we recommend using helm upgrade to update your
installation.
For example, assuming you have the following installation:
$ helm list -n kiali-operator
NAME            NAMESPACE       REVISION        UPDATED                                 STATUS          CHART                   APP VERSION
kiali-operator  kiali-operator  1               2021-09-14 18:00:45.320351026 -0500 CDT deployed        kiali-operator-1.40.0   v1.40.0
Notice that the current installation is version 1.40.0 of the
kiali-operator. Let’s assume you want to use your own mirrors of the Kiali
Operator container images. You can update your installation with the following
command:
$ helm upgrade \
    --namespace kiali-operator \
    --reuse-values \
    --set image.repo=your_mirror_registry_url/owner/kiali-operator-repo \
    --set image.tag=your_mirror_tag \
    --version 1.40.0 \
    kiali-operator \
    kiali/kiali-operator
--reuse-values flag to take the
configuration of your current installation. Then, you only need to specify the
new settings you want to change using --set flags.
--version X.Y.Z flag with the
version of your current installation. Otherwise, you may end up upgrading to a
new version.
Uninstalling
Removing the Kiali operator and managed Kialis
If you used the kiali-operator Helm chart, first you must ensure that all
Kiali CRs are deleted. For example, the following command will agressively
delete all Kiali CRs in your cluster:
$ kubectl delete kiali --all --all-namespaces
The previous command may take some time to finish while the Kiali operator removes all Kiali installations.
Then, remove the Kiali operator using a standard helm uninstall command. For
example:
$ helm uninstall --namespace kiali-operator kiali-operator
$ kubectl delete crd kialis.kiali.io
kialis.kiali.io CRD because
Helm won’t delete it.
Known problem: uninstall hangs (unable to delete the Kiali CR)
Typically this happens if not all Kiali CRs are deleted prior to uninstalling the operator. To force deletion of a Kiali CR, you need to clear its finalizer. For example:
$ kubectl patch kiali kiali -n istio-system -p '{"metadata":{"finalizers": []}}' --type=merge
Removing standalone Kiali
If you installed a standalone Kiali by using the kiali-server Helm chart, use
the standard helm uninstall commands. For example:
$ helm uninstall --namespace istio-system kiali-server
1.2.3 - Install via OperatorHub
Introduction
The OperatorHub is a website that contains a catalog of Kubernetes Operators. Its aim is to be the central location to find Operators.
The OperatorHub relies in the Operator Lifecycle Manager (OLM) to install, manage and update Operators on any Kubernetes cluster.
The Kiali Operator is being published to the OperatorHub. So, you can use the OLM to install and manage the Kiali Operator installation.
Installing the Kiali Operator using the OLM
Go to the Kiali Operator page in the OperatorHub: https://operatorhub.io/operator/kiali.
You will see an Install button at the right of the page. Press it and you will be presented with the installation instructions. Follow these instructions to install and manage the Kiali Operator installation using OLM.
Afterwards, you can create the Kiali CR to install Kiali.
Installing the Kiali Operator in OpenShift
The OperatorHub is bundled in the OpenShift console. To install the Kiali Operator, simply go to the OperatorHub in the OpenShift console and search for the Kiali Operator. Then, click on the Install button and follow the instruction on the screen.
Afterwards, you can create the Kiali CR to install Kiali.
1.2.4 - The Kiali CR
The Kiali Operator watches the Kiali Custom Resource (Kiali CR), a YAML file that holds the deployment configuration. Creating, updating, or removing a Kiali CR will trigger the Kiali Operator to install, update, or remove Kiali.
The Operator provides comprehensive defaults for all properties of the Kiali
CR. Hence, the minimal Kiali CR does not have a spec:
apiVersion: kiali.io/v1alpha1
kind: Kiali
metadata:
  name: kiali
Assuming you saved the previous YAML to a file named my-kiali-cr.yaml, and that you are
installing Kiali in the same default namespace as Istio, create the resource with the following command:
$ kubectl apply -f my-kiali-cr.yaml -n istio-system
Once created, the Kiali Operator should shortly be notified and will process the resource, performing the Kiali
installation. You can check installation progress by inspecting the status attribute of the created Kiali CR:
$ kubectl describe kiali -n istio-system
Name:         kiali
Namespace:    istio-system
Labels:       <none>
Annotations:  <none>
API Version:  kiali.io/v1alpha1
Kind:         Kiali

  (...some output is removed...)

Status:
  Conditions:
    Last Transition Time:  2021-09-15T17:17:40Z
    Message:               Running reconciliation
    Reason:                Running
    Status:                True
    Type:                  Running
  Deployment:
    Instance Name:  kiali
    Namespace:      istio-system
  Environment:
    Is Kubernetes:       true
    Kubernetes Version:  1.21.2
    Operator Version:    v1.40.0
  Progress:
    Duration:  0:00:16
    Message:   5. Creating core resources
Events:        <none>
You may want to check the example install page to see some examples where the Kiali CR has a spec and to better
understand its structure. Most available attributes of the Kiali CR are
described in the pages of the Installation and
Configuration sections of the
documentation. For a complete list, see the Kiali CR Reference.
spec.deployment.accessible_namespaces setting in the CR. See the
Namespace Management page
for more information.
Once you created a Kiali CR, you can manage your Kiali installation by editing the resource using the usual Kubernetes tools:
$ kubectl edit kiali kiali -n istio-system
To confirm your Kiali CR is valid, you can utilize the Kiali CR validation tool.
1.2.5 - Accessing Kiali
Introduction
After Kiali is succesfully installed you will need to make Kiali accessible to users. This page describes some popular methods of exposing Kiali for use.
If exposing Kiali in a custom way, you may need to set some configurations to make Kiali aware of how users will access Kiali.
istio-system namespace.
Accessing Kiali using port forwarding
You can use port-forwarding to access Kiali by running any of these commands:
# If you have oc command line tool
oc port-forward svc/kiali 20001:20001 -n istio-system
# If you have kubectl command line tool
kubectl port-forward svc/kiali 20001:20001 -n istio-system
These commands will block. Access Kiali by visiting https://localhost:20001/ in
your preferred web browser.
Accessing Kiali through an Ingress
You can configure Kiali to be installed with an
Ingress resource
defined, allowing you to access
the Kiali UI through the Ingress. By default, an Ingress will not be created. You can
enable a simple Ingress by setting spec.deployment.ingress.enabled to true in the Kiali
CR (a similar setting for the server Helm chart is available if you elect to install Kiali
via Helm as opposed to the Kiali Operator).
Exposing Kiali externally through this spec.deployment.ingress mechanism is a
convenient way of exposing Kiali externally but it will not necessarily work or
be the best way to do it because the way in which you should expose Kiali
externally will be highly dependent on your specific cluster environment and
how services are exposed generally for that environment.
spec.deployment.ingress.enabled: false. Note that the Route is required
if you configure Kiali to use the auth strategy of openshift (which is the default
auth strategy Kiali will use when installed on OpenShift).
The default Ingress that is created will be configured for a typical NGinx implementation. If you have your own
Ingress implementation you want to use, you can override the default configuration through
the settings spec.deployment.ingress.override_yaml and spec.deployment.ingress.class_name.
More details on customizing the Ingress can be found below.
The Ingress IP or domain name should then be used to access the Kiali UI. To find your Ingress IP or domain name, as per the Kubernetes documentation, try the following command (though this may not work if using Minikube without the ingress addon):
kubectl get ingress kiali -n istio-system -o jsonpath='{.status.loadBalancer.ingress[0].ip}'
If it doesn’t work, unfortunately, it depends on how and where you had setup your cluster. There are several Ingress controllers available and some cloud providers have their own controller or preferred exposure method. Check the documentation of your cloud provider. You may need to customize the pre-installed Ingress rule or expose Kiali using a different method.
Customizing the Ingress resource
The created Ingress resource will route traffic to Kiali regardless of the domain in the URL. You may need a more specific Ingress resource that routes traffic to Kiali only on a specific domain or path. To do this, you can specify route settings.
Alternatively, and for more advanced Ingress configurations, you can provide your own Ingress declaration in the Kiali CR. For example:
deployment.ingress.override_yaml will be applied
to the created Route. The deployment.ingress.class_name is ignored on OpenShift.
spec:
  deployment:
    ingress:
      class_name: "nginx"
      enabled: true
      override_yaml:
        metadata:
          annotations:
            nginx.ingress.kubernetes.io/secure-backends: "true"
            nginx.ingress.kubernetes.io/backend-protocol: "HTTPS"
        spec:
          rules:
          - http:
              paths:
              - path: /kiali
                backend:
                  serviceName: kiali
                  servicePort: 20001
Accessing Kiali in Minikube
If you enabled the Ingress controller, the default Ingress resource created by the installation (mentioned in the previous section) should be enough to access Kiali. The following command should open Kiali in your default web browser:
xdg-open https://$(minikube ip)/kiali
Accessing Kiali through a LoadBalancer or a NodePort
By default, the Kiali service is created with the ClusterIP type. To use a
LoadBalancer or a NodePort, you can change the service type in the Kiali CR as
follows:
spec:
  deployment:
    service_type: LoadBalancer
Once the Kiali operator updates the installation, you should be able to use
the kubectl get svc -n istio-system kiali command to retrieve the external
address (or port) to access Kiali. For example, in the following output Kiali
is assigned the IP 192.168.49.201, which means that you can access Kiali by
visiting http://192.168.49.201:20001 in a browser:
NAME    TYPE           CLUSTER-IP       EXTERNAL-IP      PORT(S)                          AGE
kiali   LoadBalancer   10.105.236.127   192.168.49.201   20001:31966/TCP,9090:30128/TCP   34d
If you are using the LoadBalancer service type to directly expose the Kiali
service, you may want to check the available options for the
HTTP Server and
Metrics server.
Accessing Kiali through an Istio Ingress Gateway
If you want to take advantage of Istio’s infrastructure, you can expose Kiali using an Istio Ingress Gateway. The Istio documentation provides a good guide explaining how to expose the sample add-ons. Even if the Istio guide is focused on the sample add-ons, the steps are the same to expose a Kiali installed using this Installation guide.
Accessing Kiali in OpenShift
By default, Kiali is exposed through a Route if installed on OpenShift. The following command should open Kiali in your default web browser:
xdg-open https://$(oc get routes -n istio-system kiali -o jsonpath='{.spec.host}')/console
Specifying route settings
If you are using your own exposure method or if you are using one of the methods mentioned in this page, you may need to configure the route that is being used to access Kiali.
In the Kiali CR, route settings are broken in several attributes. For example,
to specify that Kiali is being accessed under the
https://apps.example.com:8080/dashboards/kiali URI, you would need to set the
following:
spec:
  server:
    web_fqdn: apps.example.com
    web_port: 8080
    web_root: /dashboards/kiali
    web_schema: https
If you are letting the installation create an Ingress resource for you, the Ingress will be adjusted to match these route settings. If you are using your own exposure method, these spec.server settings are only making Kiali aware of what its public endpoint is.
It is possible to omit these settings and Kiali may be able to discover some of
these configurations, depending on your exposure method. For example, if you
are exposing Kiali via LoadBalancer or NodePort service types, Kiali can
discover most of these settings. If you are using some kind of Ingress, Kiali
will honor X-Forwarded-Proto, X-Forwarded-Host and X-Forwarded-Port HTTP
headers if they are properly injected in the request.
The web_root receives special treatment, because this is the path where Kiali
will serve itself (both the user interface and its api). This is useful if you
are serving multiple applications under the same domain. It must begin with a
slash and trailing slashes must be omitted. The default value is /kiali for
Kubernetes and / for OpenShift.
1.2.6 - Advanced Install
Multiple Istio control planes in the same cluster
Currently, Kiali can manage only one Istio control plane. However, there are certain cases where you may have more than one Istio control plane in your cluster. One of such cases is when performing a Canary upgrade of Istio.
In these cases, you will need to configure in Kiali which control plane you want to manage. This is done by configuring the name of the components of the control plane. This is configured in the Kiali CR and the default values are the following:
spec:
  external_services:
    istio:
      config_map_name: "istio"
      istiod_deployment_name: "istiod"
      istio_sidecar_injector_config_map_name: "istio-sidecar-injector"
If you want to manage both Istio control planes, simply install two Kiali instances and point each one to a different Istio control plane.
Installing a Kiali Server of a different version than the Operator
When you install the Kiali Operator, it will be configured to install a Kiali Server that is the same version as the operator itself. For example, if you have Kiali Operator v1.34.0 installed, that operator will install Kiali Server v1.34.0. If you upgrade (or downgrade) the Kiali Operator, the operator will in turn upgrade (or downgrade) the Kiali Server.
There are certain use-cases in which you want the Kiali Operator to install a Kiali Server whose version is different than the operator version. Read the following section «Using a custom image registry» section to learn how to configure this setup.
Using a custom image registry
Kiali is released and published to the Quay.io container image registry. There is a repository hosting the Kiali operator images and another one for the Kiali server images.
If you need to mirror the Kiali container images to some other registry, you still can use Helm to install the Kiali operator as follows:
$ helm install \
    --namespace kiali-operator \
    --create-namespace \
    --set image.repo=your.custom.registry/owner/kiali-operator-repo
    --set image.tag=your_custom_tag
    --set allowAdHocKialiImage=true
    kiali-operator \
    kiali/kiali-operator
--set allowAdHocKialiImage=true which allows specifying a
custom image in the Kiali CR. For security reasons, this is disabled by
default.
Then, when creating the Kiali CR, use the following attributes:
spec:
  deployment:
    image_name: your.custom.registry/owner/kiali-server-repo
    image_version: your_custom_tag
Change the default image
As explained earlier, when you install the Kiali Operator, it will be
configured to install a Kiali Server whose image will be pulled from quay.io
and whose version will be the same as the operator. You can ask the operator to
use a different image by setting spec.deployment.image_name and
spec.deployment.image_version within the Kiali CR (as explained above).
However, you may wish to alter this default behavior exhibited by the operator.
In other words, you may want the operator to install a different Kiali Server
image by default. For example, if you have an air-gapped environment with its
own image registry that contains its own copy of the Kiali Server image, you
will want the operator to install a Kiali Server that uses that image by
default, as opposed to quay.io/kiali/kiali. By configuring the operator to do
this, you will not force the authors of Kiali CRs to have to explicitly define
the spec.deployment.image_name setting and you will not need to enable the
allowAdHocKialiImage setting in the operator.
To change the default Kiali Server image installed by the operator, set the
environment variable RELATED_IMAGE_kiali_default in the Kiali Operator
deployment. The value of that environment variable must be the full image tag
in the form repoName/orgName/imageName:versionString (e.g.
my.internal.registry.io/mykiali/mykialiserver:v1.50.0). You can do this when
you install the operator via helm:
$ helm install \
    --namespace kiali-operator \
    --create-namespace \
    --set "env[0].name=RELATED_IMAGE_kiali_default" \
    --set "env[0].value=my.internal.registry.io/mykiali/mykialiserver:v1.50.0" \
    kiali-operator \
    kiali/kiali-operator
Development Install
This option installs the latest Kiali Operator and Kiali Server images which are built from the master branches of Kiali GitHub repositories. This option is good for demo and development installations.
helm install \
  --set cr.create=true \
  --set cr.namespace=istio-system \
  --set cr.spec.deployment.image_version=latest \
  --set image.tag=latest \
  --namespace kiali-operator \
  -- create-namespace \
  kiali-operator \
  kiali/kiali-operator
1.2.7 - Example Install
This is a quick example of installing Kiali. This example will install the operator and two Kiali Servers - one server will require the user to enter credentials at a login screen in order to obtain read-write access and the second server will allow anonymous read-only access.
For this example, assume there is a Minikube Kubernetes cluster running with an
Istio control plane installed in the namespace istio-system and
the Istio Bookinfo Demo installed in the namespace bookinfo:
$ kubectl get deployments.apps -n istio-system
NAME                   READY   UP-TO-DATE   AVAILABLE   AGE
grafana                1/1     1            1           8h
istio-egressgateway    1/1     1            1           8h
istio-ingressgateway   1/1     1            1           8h
istiod                 1/1     1            1           8h
jaeger                 1/1     1            1           8h
prometheus             1/1     1            1           8h

$ kubectl get deployments.apps -n bookinfo
NAME             READY   UP-TO-DATE   AVAILABLE   AGE
details-v1       1/1     1            1           21m
productpage-v1   1/1     1            1           21m
ratings-v1       1/1     1            1           21m
reviews-v1       1/1     1            1           21m
reviews-v2       1/1     1            1           21m
reviews-v3       1/1     1            1           21m
Install Kiali Operator via Helm Chart
First, the Kiali Operator will be installed in the kiali-operator namespace using the operator helm chart:
$ helm repo add kiali https://kiali.org/helm-charts
$ helm repo update kiali
$ helm install \
    --namespace kiali-operator \
    --create-namespace \
    kiali-operator \
    kiali/kiali-operator
Install Kiali Server via Operator
Next, the first Kiali Server will be installed. This server will require the user to enter a Kubernetes token in order to log into the Kiali dashboard and will provide the user with read-write access. To do this, a Kiali CR will be created that looks like this (file: kiali-cr-token.yaml):
apiVersion: kiali.io/v1alpha1
kind: Kiali
metadata:
  name: kiali
  namespace: istio-system
spec:
  auth:
    strategy: "token"
  deployment:
    accessible_namespaces: ["bookinfo"]
    view_only_mode: false
  server:
    web_root: "/kiali"
This Kiali CR will command the operator to deploy the Kiali Server in the same namespace where the Kiali CR is (istio-system). The operator will configure the server to: respond to requests to the web root path of /kiali, enable read-write access, use the authentication strategy of token, and be given access to the bookinfo namespace:
$ kubectl apply -f kiali-cr-token.yaml
Get the Status of the Installation
The status of a particular Kiali Server installation can be found by examining the status field of its corresponding Kiali CR. For example:
$ kubectl get kiali kiali -n istio-system -o jsonpath='{.status}'
When the installation has successfully completed, the status field will look something like this (when formatted):
$ kubectl get kiali kiali -n istio-system -o jsonpath='{.status}' | jq
{
  "conditions": [
    {
      "ansibleResult": {
        "changed": 21,
        "completion": "2021-10-20T19:17:35.519131",
        "failures": 0,
        "ok": 102,
        "skipped": 90
      },
      "lastTransitionTime": "2021-10-20T19:17:12Z",
      "message": "Awaiting next reconciliation",
      "reason": "Successful",
      "status": "True",
      "type": "Running"
    }
  ],
  "deployment": {
    "accessibleNamespaces": "bookinfo,istio-system",
    "instanceName": "kiali",
    "namespace": "istio-system"
  },
  "environment": {
    "isKubernetes": true,
    "kubernetesVersion": "1.20.2",
    "operatorVersion": "v1.41.0"
  },
  "progress": {
    "duration": "0:00:20",
    "message": "7. Finished all resource creation"
  }
}
Access the Kiali Server UI
The Kiali Server UI is accessed by pointing a browser to the Kiali Server endpoint and requesting the web root /kiali:
xdg-open http://$(minikube ip)/kiali
Because the auth.strategy was set to token, that URL will display the Kiali login screen that will require a Kubernetes token in order to authenticate with the server. For this example, you can use the token that belongs to the Kiali service account itself:
$ kubectl get secret -n istio-system $(kubectl get sa kiali-service-account -n istio-system -o jsonpath='{.secrets[0].name}') -o jsonpath='{.data.token}' | base64 -d
The output of that command above can be used to log into the Kiali login screen.
Install a Second Kiali Server
The second Kiali Server will next be installed. This server will not require the user to enter any login credentials but will only provide a view-only look at the service mesh. To do this, a Kiali CR will be created that looks like this (file: kiali-cr-anon.yaml):
apiVersion: kiali.io/v1alpha1
kind: Kiali
metadata:
  name: kiali
  namespace: kialianon
spec:
  installation_tag: "Kiali - View Only"
  istio_namespace: "istio-system"
  auth:
    strategy: "anonymous"
  deployment:
    accessible_namespaces: ["bookinfo"]
    view_only_mode: true
    instance_name: "kialianon"
  server:
    web_root: "/kialianon"
This Kiali CR will command the operator to deploy the Kiali Server in the same namespace where the Kiali CR is (kialianon). The operator will configure the server to: respond to requests to the web root path of /kialianon, disable read-write access, not require the user to authenticate, have a unique instance name of kialianon and be given access to the bookinfo namespace. The Kiali UI will also show a custom title in the browser tab so the user is aware they are looking at a “view only” Kiali dashboard. The unique deployment.instance_name is needed in order for this Kiali Server to be able to share access to the Bookinfo application with the first Kiali Server.
$ kubectl create namespace kialianon
$ kubectl apply -f kiali-cr-anon.yaml
The UI for this second Kiali Server is accessed by pointing a browser to the Kiali Server endpoint and requesting the web root /kialianon. Note that no credentials are required to gain access to this Kiali Server UI because auth.strategy was set to anonymous; however, the user will not be able to modify anything via the Kiali UI - it is strictly “view only”:
xdg-open http://$(minikube ip)/kialianon
Reconfigure Kiali Server
A Kiali Server can be reconfigured by simply editing its Kiali CR. The Kiali Operator will perform all the necessary tasks to complete the reconfiguration and reboot the Kiali Server pod when necessary. For example, to change the web root for the Kiali Server:
$ kubectl patch kiali kiali -n istio-system --type merge --patch '{"spec":{"server":{"web_root":"/specialkiali"}}}'
The Kiali Operator will update the necessary resources (such as the Kiali ConfigMap) and will reboot the Kiali Server pod to pick up the new configuration.
Uninstall Kiali Server
To uninstall a Kiali Server installation, simply delete the Kiali CR. The Kiali Operator will then perform all the necessary tasks to remove all remnants of the associated Kiali Server.
kubectl delete kiali kiali -n istio-system
Uninstall Kiali Operator
To uninstall the Kiali Operator, use helm uninstall and then manually remove the Kiali CRD.
$ kubectl delete kiali --all --all-namespaces
$ helm uninstall --namespace kiali-operator kiali-operator
$ kubectl delete crd kialis.kiali.io
1.3 - Deployment Options
There are other, more complex deployment settings, described in dedicated pages:
- Authentication
- Customization of the Ingress resource
- Customization of the service type (LoadBalancer or NodePort)
- Namespace management (configuring namespaces accessible and visible to Kiali)
Kiali and Istio installation namespaces
By default, the Kiali operator installs Kiali in the same namespace where the Kiali CR is created. However, it is possible to specify a different namespace for installation:
spec:
  deployment:
    namespace: "custom-kiali-namespace"
It is assumed that Kiali is installed to the same namespace as Istio. Kiali reads some Istio resources and may not work properly if those resources are not found. Thus, if you are installing Kiali and Istio on different namespaces, you must specify what is the Istio namespace:
spec:
  istio_namespace: "istio-system"
Log level and format
By default, Kiali will print up to INFO-level messages in simple text format.
You can change the log level, output format, and time format as in the
following example:
spec:
  deployment:
    logger:
      # Supported values are "trace", "debug", "info", "warn", "error" and "fatal"
      log_level: error
      # Supported values are "text" and "json".
      log_format: json
      time_field_format: "2006-01-02T15:04:05Z07:00"
The syntax for the time_field_format is the same as the Time.Format
function of the Go language.
The json format is useful if you are parsing logs of your applications for
further processing.
In Kiali, there are some special logs called audit logs that are emitted each time a user creates, updates or deletes a resource through Kiali. Audit logs are INFO-level messages and are enabled by default. If audit logs are too verbose, you can disable them without reducing the log level as follows:
spec:
  server:
    audit_log: false
Kiali instance name
If you plan to install more than one Kiali instance on the same cluster, you may need to configure an instance name to avoid conflicts on created resources:
spec:
  deployment:
    instance_name: "secondary"
The instance_name will be used as a prefix for all created Kiali resources.
The exception is the kiali-signing-key secret which will always have
the same name and will be shared on all deployments of the same namespace,
unless you specify a custom secret name.
instance_name will be used as a name prefix in resources, it must
follow Kubernetes naming
constraints.
instance_name of an existing Kiali installation. The workaround is to
uninstall Kiali and re-install with the desired instance_name.
Resource requests and limits
You can set the amount of resources available to Kiali using the
spec.deployment.resources attribute, like in the following example:
spec:
  deployment:
    resources:
      requests:
        memory: "128Mi"
        cpu: "100m"
      limits:
        memory: "1Gi"
        cpu: "500m"
Please, read the Managing Resources for Containers section in the Kubernetes documentation for more details about possible configurations.
Custom labels and annotations on the Kiali pod and service
Although some labels and annotations are set on the Kiali pod and on its
service (depending on configurations), you can add additional ones. For the
pod, use the spec.deployment.pod_labels and spec.deployment.pod_annotations
attributes. For the service, you can only add annotations using the
spec.deployment.service_annotations attribute. For example:
spec:
  deployment:
    pod_annotations:
      a8r.io/repository: "https://github.com/kiali/kiali"
    pod_labels:
      sidecar.istio.io/inject: "true"
    service_annotations:
      a8r.io/documentation: "https://kiali.io/docs/installation/deployment-configuration"
Kiali page title (browser title bar)
If you have several Kiali installations and you are using them at the same time, there are good chances that you will want to identify each Kiali by simply looking at the browser’s title bar. You can set a custom text in the title bar with the following configuration:
spec:
  installation_tag: "Kiali West"
The installation_tag is any human readable text of your desire.
Kubernetes scheduler settings
Replicas and automatic scaling
By default, only one replica of Kiali is deployed. If needed, you can change the replica count like in the following example:
spec:
  deployment:
    replicas: 2
If you prefer automatic scaling, creation of an HorizontalPodAutoscaler
resource is supported. For example, the following configuration automatically
scales Kiali based on CPU utilization:
spec:
  deployment:
    hpa:
      api_version: "autoscaling/v1"
      spec:
        minReplicas: 1
        maxReplicas: 2
        targetCPUUtilizationPercentage: 80
scaleTargetRef field of the HPA spec, because this field
will be populated by the Kiali operator (or by Helm) depending on other
configuration.
Read the Kubernetes Horizontal Pod Autoscaler documentation to learn more about the HPA.
Allocating the Kiali pod to specific nodes of the cluster
You can constrain the Kiali pod to run on a specific set of nodes by using some of the standard Kubernetes scheduler configurations.
The simplest option is to use the
nodeSelector
configuration which you can configure like in the following example:
spec:
  deployment:
    node_selector:
      worker-type: infra
You can also use the affinity/anti-affinity native Kubernetes feature if you prefer its more expressive syntax, or if you need more complex matching rules. The following is an example for configuring node affinity:
spec:
  deployment:
    affinity:
      node:
        requiredDuringSchedulingIgnoredDuringExecution:
          nodeSelectorTerms:
          - matchExpressions:
            - key: worker-type
              operator: In
              values:
              - infra
Similarly, you can also configure pod affinity and pod anti-affinity using the
spec.deployment.affinity.pod and spec.deployment.affinity.pod_anti
attributes.
Finally, if you want to run Kiali in a node with taints, the following is an example to configure tolerations:
spec:
  deployment:
    tolerations: # Allow to run Kiali in a tainted master node
    - key: "node-role.kubernetes.io/master"
      operator: "Exists"
      effect: "NoSchedule"
Read the following Kubernetes documentation to learn more about these configurations:
Priority class of the Kiali pod
If you are using priority classes in your cluster, you can specify the priority class that will be set on the Kiali pod. For example:
spec:
  deployment:
    priority_class_name: high-priority
For more information about priority classes, read Pod Priority and Preemption in the Kubernetes documentation.
Adding host aliases to the Kiali pod
If you need to provide some static hostname resolution in the Kiali pod, you
can use HostAliases to add entries to the /etc/hosts
file
of the Kiali pod, like in the following example:
spec:
  deployment:
   host_aliases:
   - ip: 192.168.1.100
     hostnames:
     - "foo.local"
     - "bar.local"
HTTP server
Kiali is served over HTTP. You can configure a few options of the HTTP server. The following are the defaults, but you can change them to suit your needs.
spec:
  server:
    # Listen/bind address of the HTTP server. By default it is empty, which means to
    # listen on all interfaces.
    address: ""

    # Listening port of the HTTP server. If you change it, also Kiali's Kubernetes
    # Service is affected to use this port.
    port: 20001

    # Use GZip compression for responses larger than 1400 bytes. You may want to disable
    # compression if you are exposing Kiali via a reverse proxy that is already
    # doing compression.
    gzip_enabled: true

    # For development purposes only. Controls if "Cross-Origin Resourse Sharing" is
    # enabled.
    cors_allow_all: false
There is one additional spec.server.web_root option that affects the HTTP
server, but that one is described in the Specifying route settings section
of the Instalation guide.
Metrics server
Kiali emits metrics that can be collected by Prometheus. Most of these metrics are performance measurements.
The metrics server is enabled by default and listens on port 9090:
spec:
  server:
    metrics_enabled: true
    metrics_port: 9090
The bind address is the same as the HTTP server. Thus, make sure that the HTTP Server and the metrics server are not configured to the same port.
2 - Configuration
The pages in this Configuration section describe most available options for managing and customizing your Kiali installation.
Unless noted, it is assumed that you are using the Kiali operator and that you are managing the Kiali installation through a Kiali CR. The provided YAML snippets for configuring Kiali should be placed in your Kiali CR. For example, the provided configuration snippet for setting up the Anonymous authentication strategy is the following:
spec:
  auth:
    strategy: anonymous
You will need to take this YAML snippet and apply it to your Kiali CR. As an example, an almost minimal Kiali CR using the previous configuration snippet would be the following:
apiVersion: kiali.io/v1alpha1
kind: Kiali
metadata:
  namespace: kiali-namespace
  name: kiali
spec:
  istio_namespace: istio-system
  deployment:
    namespace: kiali-namespace
  auth:
    strategy: anonymous
Then, you can save the finished YAML file and apply it with kubectl apply -f.
It is recommended that you read The Kiali CR and the Example Install pages of the Installation Guide for more information about using the Kiali CR.
Also, for reference, see Kiali CR Reference which documents all available options.
2.1 - Authentication Strategies
Kiali supports five authentication mechanisms:
- The default authentication strategy for OpenShift clusters is
openshift. - The default authentication strategy for all other Kubernetes clusters is
token.
All mechanisms other than anonymous support Role-based access control.
Read the dedicated page of each authentication strategy to learn more.
2.1.1 - Anonymous strategy
Introduction
The anonymous strategy removes any authentication requirement. Users will
have access to Kiali without providing any credentials.
Although the anonymous strategy doesn’t provide any access protection, it’s
valid for some use-cases. Some examples known from the community:
- Exposing Kiali through a reverse proxy, where the reverse proxy is providing a custom authentication mechanism.
- Exposing Kiali on an already limited network of trusted users.
- When Kiali is accessed through
kubectl port-forwardor alike commands that allow usage of the cluster’s RBAC capabilities to limit access. - When developing Kiali, where a developer has a private instance on his own machine.
anonymous
strategy will leave Kiali unsecured. If you are using this option, make sure
that Kiali is available only to trusted users, or access is protected by other
means.
Set-up
To use the anonymous strategy, use the following configuration in the Kiali CR:
spec:
  auth:
    strategy: anonymous
The anonymous strategy doesn’t have any additional configuration.
Access control
When using the anonymous strategy, the content displayed in Kiali is based on
the permissions of the Kiali service account. By default, the Kiali service
account has cluster wide access and will be able to display everything in the
cluster.
OpenShift
If you are running Kiali in OpenShift, access can be customized by changing privileges to the Kiali ServiceAccount. For example, to reduce permissions to individual namespaces, first, remove the cluster-wide permissions granted by default:
oc delete clusterrolebindings kiali
Then grant the kiali role only in needed namespaces. For example:
oc adm policy add-role-to-user kiali system:serviceaccount:istio-system:kiali-service-account -n ${NAMESPACE}
View only
You can tell the Kiali Operator to install Kiali in “view only”
mode (this does work for either OpenShift or Kubernetes). You do this by
setting the view_only_mode to true in the Kiali CR, which
allows Kiali to read service mesh resources found in the cluster, but it does
not allow any change:
spec:
  deployment:
    view_only_mode: true
2.1.2 - Header strategy
Introduction
The header strategy assumes a reverse proxy is in front of Kiali, such as
OpenUnison or OAuth2 Proxy, injecting the user’s identity into each request to
Kiali as an Authorization header. This token can be an OpenID Connect
token or any other token the cluster recognizes. All requests to Kubernetes
will be made with this token, allowing Kiali to use the user’s own RBAC
context.
In addition to a user token, the header strategy supports impersonation
headers. If the impersonation headers are present in the request, then Kiali
will act on behalf of the user specified by the impersonation (assuming the
token supplied in the Authorization header is authorized to do so).
The header strategy takes advantage of the cluster’s RBAC. See the
Role-based access control documentation for more details.
Set-up
The header strategy will work with any Kubernetes cluster. The token provided
must be supported by that cluster. For instance, most “on-prem” clusters support
OpenID Connect, but cloud hosted clusters do not. For clusters that don’t support
a token, the impersonation
headers can be injected by the reverse proxy.
spec:
  auth:
    strategy: header
The header strategy doesn’t have any additional configuration.
HTTP Header
The header strategy looks for a token in the Authorization HTTP header with the
Bearer prefix. The HTTP header should look like:
Authorization: Bearer TOKEN
Where TOKEN is the appropriate token for your cluster. This TOKEN will be
submitted to the API server via a TokenReview to validate the token ONLY
on the first access to Kiali. On subsequent calls the TOKEN is passed through
directly to the API server.
Security Considerations
Network Policies
A policy should be put in place to make sure that the only “client” for Kiali is the authenticating reverse proxy. This helps limit potential abuse and ensures that the authenticating reverse proxy is the source of truth for who accessed Kiali.
Short Lived Tokens
The authenticating reverse proxy should inject a short lived token in the
Authorization header. A shorter lived token is less likely to be abused if
leaked. Kiali will take whatever token is passed into the reqeuest, so as tokens
are regenerated Kiali will use the new token.
Impersonation
TokenRequest API
The authenticating reverse proxy should use the TokenRequest API instead of static
ServiceAccount tokens when possible while using impersonation. The
ServiceAccount that can impersonate users and groups is privileged and having it
be short lived cuts down on the possibility of a token being leaked while it’s being
passed between different parts of the infrastructure.
Drop Incoming Impersonation Headers
The authenticating proxy MUST drop any headers it receives from a remote client that match the impersonation headers. Not only do you want to make sure that the authenticating proxy can’t be overriden on which user to authenticate, but also what groups they’re a member of.
2.1.3 - OpenID Connect strategy
Introduction
The openid authentication strategy lets you integrate Kiali to an external
identity provider that implements OpenID Connect, and allows
users to login to Kiali using their existing accounts of a
third-party system.
If your
Kubernetes cluster is also integrated with your OpenId provider,
then Kiali’s openid strategy can offer role-based access control (RBAC) through the
Kubernetes authorization mechanisms. See the
RBAC documentation for more details.
Currently, Kiali supports the authorization code flow (preferred) and the implicit flow of the OpenId Connect spec.
Requirements
If you want to enable usage of the OpenId’s authorization code flow, make sure that the Kiali’s signing key is 16, 24 or 32 byte long. If you setup a signing key of a different size, Kiali will only be capable of using the implicit flow. If you install Kiali via the operator and don’t set a custom signing key, the operator should create a 16 byte long signing key.
If you don’t need RBAC support, the only requirement is to have a working OpenId Server where Kiali can be configured as a client application.
If you do need RBAC support, you need either:
- A Kubernetes cluster configured with OpenID connect integration, which results in the API server accepting tokens issued by your identity provider.
- A replacement or reverse proxy for the Kubernetes cluster API capable of handling the OIDC authentication.
The first option is preferred if you can manipulate your cluster API server startup flags, which will result in your cluster to also be integrated with the external OpenID provider.
The second option is provided for cases where you are using a managed
Kubernetes and your cloud provider does not support configuring OpenID
integration. Kiali assumes an implementation of a Kubernetes API server. For
example, a community user has reported to successfully configure Kiali’s OpenID
strategy by using
kube-oidc-proxy which is a
reverse proxy that handles the OpenID authentication and forwards the
authenticated requests to the Kubernetes API.
Set-up with RBAC support
Assuming you already have a working Kubernetes cluster with OpenId integration
(or a working alternative like kube-oidc-proxy), you should already had
configured an application or a client in your OpenId server (some cloud
providers configure this app/client automatically for you). You must re-use
this existing application/client by adding the root path of your Kiali
instance as an allowed/authorized callback URL. If the OpenID server provided
you a client secret for the application/client, or if you had manually set a
client secret, issue the following command to create a Kubernetes secret
holding the OpenId client secret:
kubectl create secret generic kiali --from-literal="oidc-secret=$CLIENT_SECRET" -n $NAMESPACE
where $NAMESPACE is the namespace where you installed Kiali and
$CLIENT_SECRET is the secret you configured or provided by your OpenId
Server. If Kiali is already running, you may need to restart the Kiali pod so
that the secret is mounted in Kiali.
Then, to enable the OpenID Connect strategy, the minimal configuration you need to set in the Kiali CR is like the following:
spec:
  auth:
    strategy: openid
    openid:
      client_id: "kiali-client"
      issuer_uri: "https://openid.issuer.com"
This assumes that your Kubernetes cluster is configured with OpenID Connect
integration. In this case, the client-id and issuer_uri attributes must
match the --oidc-client-id and --oidc-issuer-url flags
used to start the cluster API server.
If these values don’t match, users will fail to login to Kiali.
If you are using a replacement or a reverse proxy for the Kubernetes API server, the minimal configuration is like the following:
spec:
  auth:
    strategy: openid
    openid:
      api_proxy: "https://proxy.domain.com:port"
      api_proxy_ca_data: "..."
      client_id: "kiali-client"
      issuer_uri: "https://openid.issuer.com"
The value of client-id and issuer_uri must match the values of the
configuration of your reverse proxy or cluster API replacement. The api_proxy
attribute is the URI of the reverse proxy or cluster API replacement (only
HTTPS is allowed). The api_proxy_ca_data is the public certificate authority
file encoded in a base64 string, to trust the secure connection.
Set-up with no RBAC support
Register Kiali as a client application in your OpenId Server. Use the root path of your Kiali instance as the callback URL. If the OpenId Server provides you a client secret, or if you manually set a client secret, issue the following command to create a Kubernetes secret holding the OpenId client secret:
kubectl create secret generic kiali --from-literal="oidc-secret=$CLIENT_SECRET" -n $NAMESPACE
where $NAMESPACE is the namespace where you installed Kiali and
$CLIENT_SECRET is the secret you configured or provided by your OpenId
Server. If Kiali is already running, you may need to restart the Kiali pod so
that the secret is mounted in Kiali.
Then, to enable the OpenID Connect strategy, the minimal configuration you need to set in the Kiali CR is like the following:
spec:
  auth:
    strategy: openid
    openid:
      client_id: "kiali-client"
      disable_rbac: true
      issuer_uri: "https://openid.issuer.com"
Additional configurations
Configuring the displayed user name
The Kiali front-end will, by default, retrieve the string of the sub claim of
the OpenID token and display it as the user name. You can customize which field
to display as the user name by setting the username_claim attribute of the
Kiali CR. For example:
spec:
  auth:
    openid:
      username_claim: "email"
If you enabled RBAC, you will want the username_claim attribute to match the
--oidc-username-claim flag used to start the Kubernetes API server, or the
equivalent option if you are using a replacement or reverse proxy of the API
server. Else, any user-friendly claim will be OK as it is purely informational.
Configuring requested scopes
By default, Kiali will request access to the openid, profile and email
standard scopes. If you need a different set of scopes, you can set the
scopes attribute in the Kiali CR. For example:
spec:
  auth:
    openid:
      scopes:
      - "openid"
      - "email"
      - "groups"
The openid scope is forced. If you don’t add it to the list of scopes to
request, Kiali will still request it from the identity provider.
Configuring authentication timeout
When the user is redirected to the external authentication system, by default
Kiali will wait at most 5 minutes for the user to authenticate. After that time
has elapsed, Kiali will reject authentication. You can adjust this timeout by
setting the authentication_timeout with the number of seconds that Kiali
should wait at most. For example:
spec:
  auth:
    openid:
      authentication_timeout: 60 # Wait only one minute.
Configuring allowed domains
Some identity providers use a shared login and regardless of configuring your own application under your domain (or organization account), login can succeed even if the user that is logging in does not belong to your account or organization. Google is an example of this kind of provider.
To prevent foreign users from logging into your Kiali instance, you can configure a list of allowed domains:
spec:
  auth:
    openid:
      allowed_domains:
      - example.com
      - foo.com
The e-mail reported by the identity provider is used for the validation. Login
will be allowed if the domain part of the e-mail is listed as an allowed
domain; else, the user will be rejected. Naturally, you will need to
configure the email scope to be requested.
There is a special case: some identity providers include a hd claim in the
id_token. If this claim is present, this is used instead of extracting the
domain from the user e-mail. For example, Google Workspace (aka G Suite)
includes this hd claim for hosted
domains.
Using an OpenID provider with a self-signed certificate
If your OpenID provider is using a self-signed certificate, you can disable
certificate validation by setting the insecure_skip_verify_tls to true in
the Kiali CR:
spec:
  auth:
    openid:
      insecure_skip_verify_tls: true
However, if your organization or internal network has an internal trusted
certificate authority (CA), and your OpenID server is using a certificate
issued by this CA, you can configure Kiali to trust certificates from this CA,
rather than disabling verification. For this, create a ConfigMap named
kiali-cabundle containing the root CA certificate (the public component)
under the openid-server-ca.crt key:
apiVersion: v1
kind: ConfigMap
metadata:
  name: kiali-cabundle
  namespace: istio-system # This is Kiali's install namespace
data:
  openid-server-ca.crt: <the public component of your CA root certificate encoded in base64>
After restarting the Kiali pod, Kiali will trust this root certificate for all HTTPS requests related to OpenID authentication.
Using an HTTP/HTTPS Proxy
In some network configurations, there is the need to use proxies to connect to
the outside world. OpenID requires outside world connections to get metadata and
do key validation, so you can configure it by setting the http_proxy and
https_proxy keys in the Kiali CR. They use the same format as the HTTP_PROXY
and HTTPS_PROXY environment variables.
spec:
  auth:
    openid:
      http_proxy: http://USERNAME:PASSWORD@10.0.1.1:8080/
      https_proxy: https://USERNAME:PASSWORD@10.0.0.1:8080/
Passing additional options to the identity provider
When users click on the Login button on Kiali, a redirection occurs to the
authentication page of the external identity provider. Kiali sends a fixed set
of parameters to the identity provider to enable authentication. If you need to
add an additional set of parameters to your identity provider, you can use the
additional_request_params setting of the Kiali CR, which accepts key-value
pairs. For example:
spec:
  auth:
    openid:
      additional_request_params:
        prompt: login
The prompt parameter is a
standard OpenID parameter.
When the login value is passed in this parameter, the
identity provider is instructed to ask for user credentials regardless if the
user already has an active session because of a previous login in some other
system.
If your OpenId provider supports other non-standard parameters, you can specify
the ones you need in this additional_request_params setting.
Take into account that you should not add the client_id, response_type,
redirect_uri, scope, nonce nor state parameters to this list. These are
already in use by Kiali and some already have a dedicated setting.
Provider-specific instructions
Using with Keycloak
When using OpenId with Keycloak, you will need to enable the Standard Flow Enabled
option on the Client (in the Administration Console):
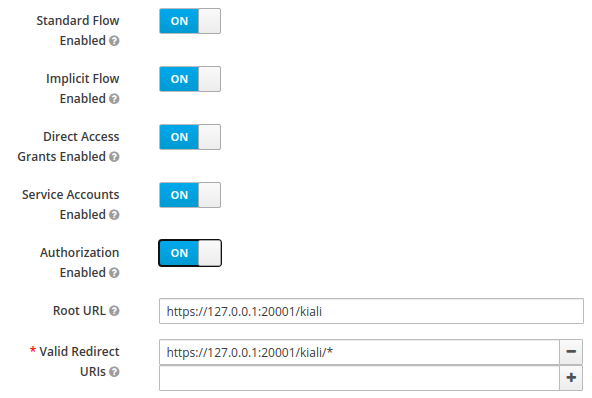
The Standard Flow described on the options is the same as the authorization code flow from the rest of the documentation.
If you get an error like Client is not allowed to initiate browser login with given response_type. Implicit flow is disabled for the client., it means that
your signing key for Kiali is not a standard size (16, 24 or 32 bytes long).
Enabling the Implicit Flow Enabled option of the client will make the problem
go away, but be aware that the implicit flow is less secure, and not
recommended.
Using with Google Cloud Platform / GKE OAuth2
If you are using Google Cloud Platform (GCP) and its products such as Google Kubernetes Engine (GKE), it should be straightforward to configure Kiali’s OpenID strategy to authenticate using your Google credentials.
First, you’ll need to go to your GCP Project and to the Credentials screen which
is available at (Menu Icon) > APIs & Services > Credentials.
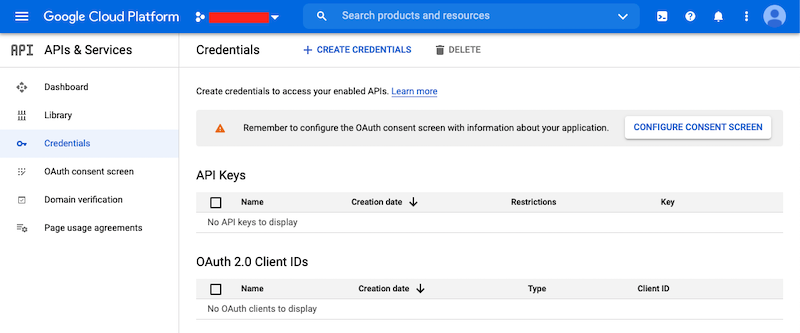
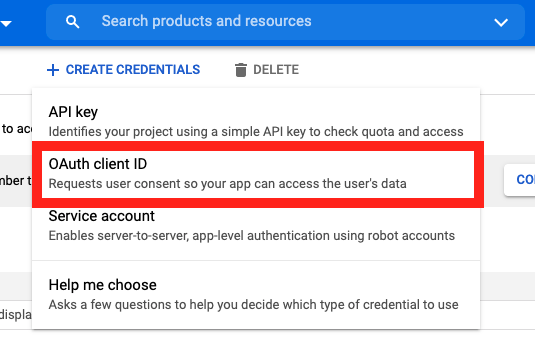
On the Credentials screen you can select to create a new OAuth client ID.
On the Create OAuth client ID screen, set the Application type to Web Application
and enter a name for your key.
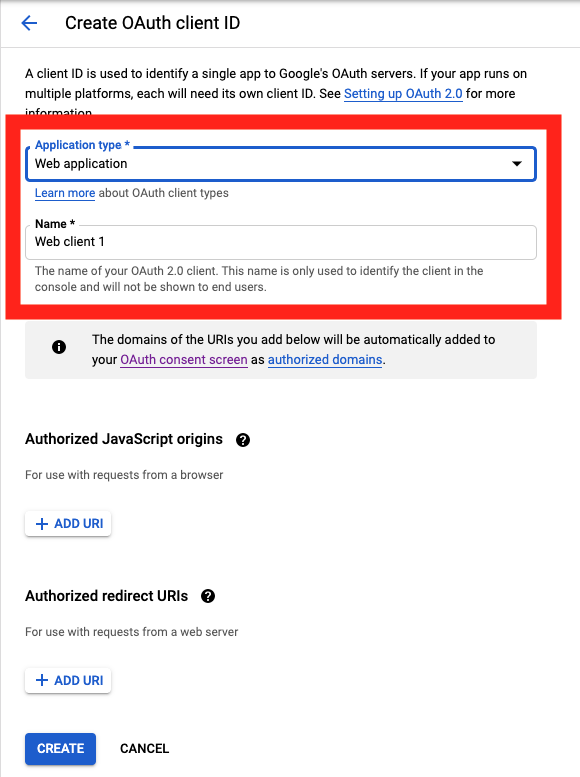
Then enter in the Authorized Javascript origins and Authorized redirect URIs for your project.
You can enter in localhost as appropriate during testing. You can also enter multiple URIs as appropriate.
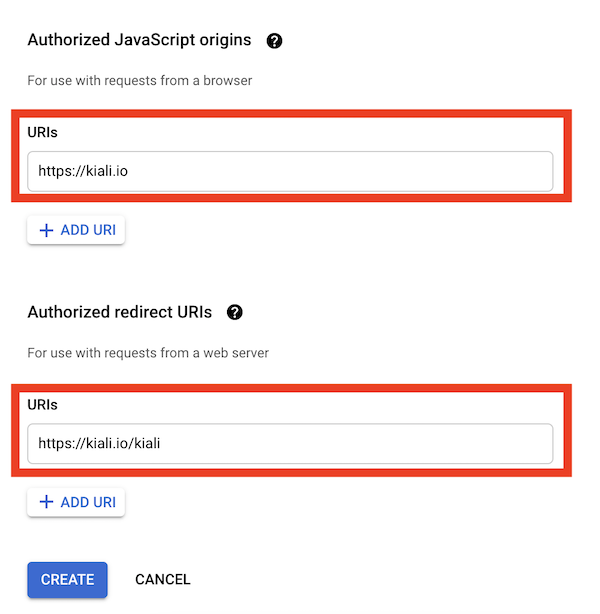
After clicking Create you’ll be shown your newly minted client id and secret. These are important and needed for your Kiali CR yaml and Kiali secrets files.
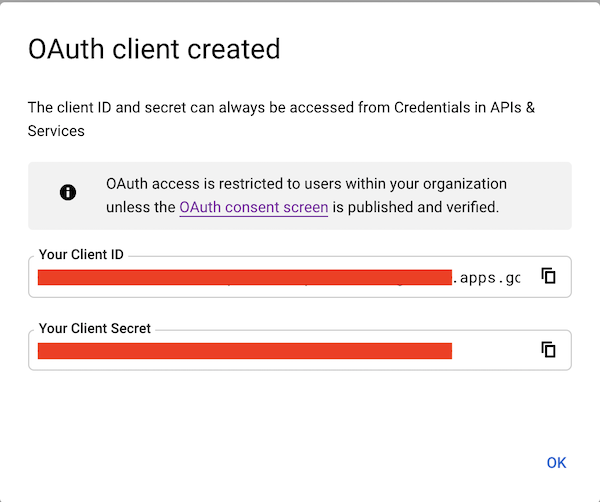
You’ll need to update your Kiali CR file to include the following auth block.
spec:
  auth:
    strategy: "openid"
    openid:
      client_id: "<your client id from GCP>"
      disable_rbac: true
      issuer_uri: "https://accounts.google.com"
      scopes: ["openid", "email"]
      username_claim: "email"
issuer_uri should be https://accounts.google.com.
Finally you will need to create a secret, if you don’t have one already, that sets the oidc-secret for the openid flow.
apiVersion: v1
kind: Secret
metadata:
  name: kiali
  namespace: istio-system
  labels:
    app: kiali
type: Opaque
data:
  oidc-secret: "<base64 encode your client secret from GCP and enter here>"
Once all these settings are complete just set your Kiali CR and the Kiali secret to your cluster. You may need to refresh your Kiali Pod to set the Secret if you add the Secret after the Kiali pod is created.
Using with Azure: AKS and AAD
AKS has support for a feature named AKS-managed Azure Active Directory, which enables integration between AKS and AAD. This has the advantage that users can use their AAD credentials to access AKS clusters and can also use Kubernetes RBAC features to assign privileges to AAD users.
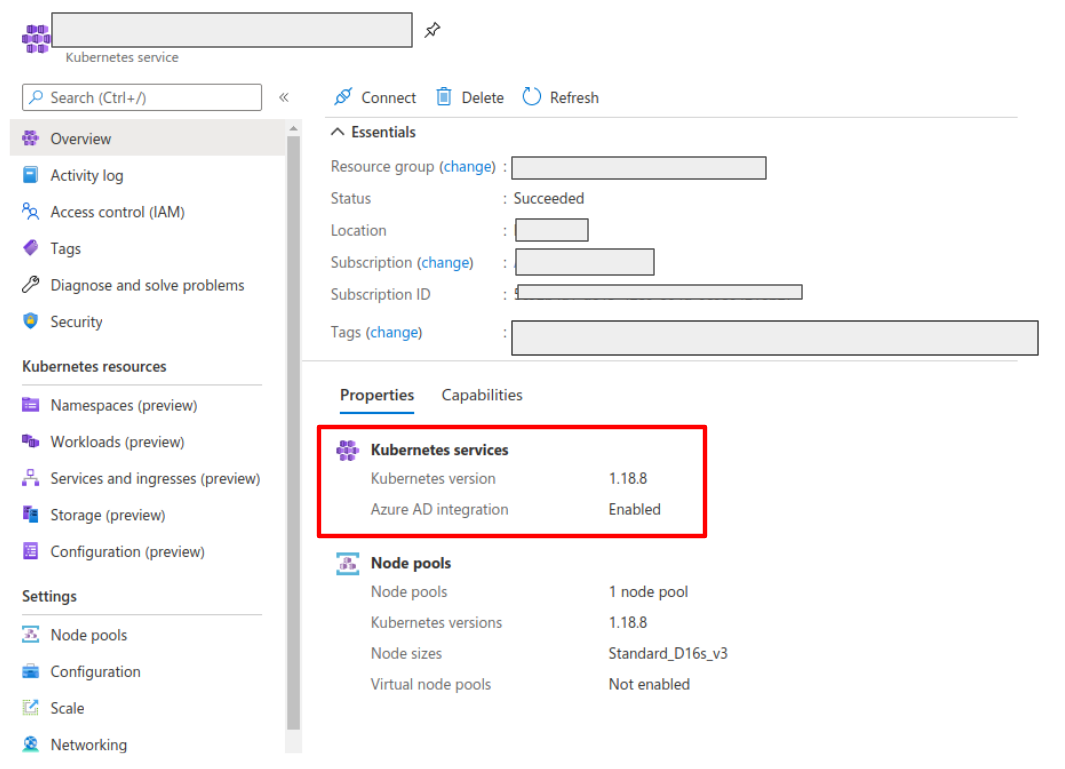
However, Azure is implementing this integration via the Kubernetes Webhook Token Authentication rather than via the Kubernetes OpenID Connect Tokens authentication (see the Azure AD integration section in AKS Concepts documentation). Because of this difference, authentication in AKS behaves slightly different from a standard OpenID setup, but Kiali’s OpenID authentication strategy can still be used with full RBAC support by following the next steps.
First, enable the AAD integration on your AKS cluster. See the official AKS documentation to learn how. Once it is enabled, your AKS panel should show the following:
Create a web application for Kiali in your Azure AD panel:
- Go to AAD > App Registration, create an application with a redirect url like
\https://<your-kiali-url> - Go to Certificates & secrets and create a client secret.
- After creating the client secret, take note of the provided secret. Create a
Kubernetes secret in your cluster as mentioned in the Set-up
with RBAC support section. Please, note that the suggested name for the
Kubernetes Secret is
kiali. If you want to customize the secret name, you will have to specify your custom name in the Kiali CR. See: secret_name in Kial CR Reference.
- After creating the client secret, take note of the provided secret. Create a
Kubernetes secret in your cluster as mentioned in the Set-up
with RBAC support section. Please, note that the suggested name for the
Kubernetes Secret is
- Go to API Permissions and press the Add a permission button. In the new page that appears, switch to the APIs my organization uses tab.
- Type the following ID in the search field:
6dae42f8-4368-4678-94ff-3960e28e3630(this is a shared ID for all Azure clusters). And select the resulting entry. - Select the Delegated permissions square.
- Select the
user.readpermission. - Go to Authentication and make sure that the Access tokens checkbox is ticked.
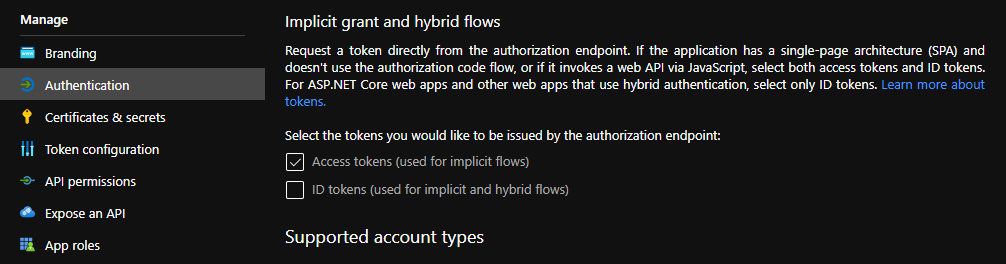
Then, create or modify your Kiali CR and include the following settings:
spec:
  auth:
    strategy: "openid"
    openid:
      client_id: "<your Kiali application client id from Azure>"
      issuer_uri: "https://sts.windows.net/<your AAD tenant id>/"
      username_claim: preferred_username
      api_token: access_token
      additional_request_params:
        resource: "6dae42f8-4368-4678-94ff-3960e28e3630"
You can find your client_id and tenant_id in the Overview page of the Kiali
App registration that you just created. See this documentation for more information.
2.1.4 - OpenShift strategy
Introduction
The openshift authentication strategy is the preferred and default strategy
when Kiali is deployed on an OpenShift cluster.
When using the openshift strategy, a user logging into Kiali will be
redirected to the login page of the OpenShift console. Once the user provides
his OpenShift credentials, he will be redireted back to Kiali and will be
logged in if the user has enough privileges.
The openshift strategy takes advantage of the cluster’s RBAC. See the
Role-based access control documentation for more
details.
Set-up
Since openshift is the default strategy when deploying Kiali in OpenShift,
you shouldn’t need to configure anything. If you want to be verbose, use the
following configuration in the Kiali CR:
spec:
  auth:
    strategy: openshift
The openshift strategy doesn’t have any additional configuration. The Kiali
operator will make sure to setup the needed OpenShift OAuth resources to register
Kiali as a client.
2.1.5 - Token strategy
Introduction
The token authentication strategy allows a user to login to Kiali using the
token of a Kubernetes ServiceAccount. This is similar to the
login view of Kubernetes Dashboard.
The token strategy takes advantage of the cluster’s RBAC. See the Role-based access control documentation
for more details.
Set-up
Since token is the default strategy when deploying Kiali in Kubernetes, you
shouldn’t need to configure anything, unless your cluster is OpenShift. If you
want to be verbose or if you need to enable the token strategy in OpenShift,
use the following configuration in the Kiali CR:
spec:
  auth:
    strategy: token
The token strategy doesn’t have any additional configuration other than the
session expiration time.
2.1.6 - Session options
There are two settings that are available for the user’s session. The first one is the session expiration time, which is only applicable to token and header authentication strategies:
spec:
  login_token:
    # By default, users session expires in 24 hours.
    expiration_seconds: 86400
The session expiration time is the amount of time before the user is asked to extend his session by another cycle. It does not matter if the user is actively using Kiali, the user will be asked if the session should be extended.
The second available option is the signing key configuration, which is unset by
default, meaning that a random 16-character signing key will be generated
and stored to a secret named kiali-signing-key, in Kiali’s installation
namespace:
spec:
  login_token:
    # By default, create a random signing key and store it in
    # a secret named "kiali-signing-key".
    signing_key: ""
If the secret already exists (which may mean a previous Kiali installation was present), then the secret is reused.
The signing key is used on security sensitive data. For example, one of the usages is to sign HTTP cookies related to the user session to prevent session forgery.
If you need to set a custom fixed key, you can pre-create or modify the
kiali-signing-key secret:
apiVersion: v1
kind: Secret
metadata:
  namespace: "kiali-installation-namespace"
  name: kiali-signing-key
type: Opaque
data:
  key: "<your signing key encoded in base64>"
If you prefer a different secret name for the signing key and/or a different key-value pair of the secret, you can specify your preferred names in the Kiali CR:
spec:
  login_token:
    signing_key: "secret:<secretName>:<secretDataKey>"
spec.login_token.signing_key attribute. However, this should be only for
testing purposes. The signing key is sensitive and should be treated like a
password that must be protected.
2.2 - Console Customization
Custom metric aggregations
The inbound and outbound metric pages, in the Metrics settings drop-down, provides an opinionated set of groupings that work both for filtering out metric data that does not match the selection and for aggregating data into series. Each option is backed by a label on the collected Istio telemetry.
It is possible to add custom aggregations, like in the following example:
spec:
  kiali_feature_flags:
    ui_defaults:
      metrics_inbound:
        aggregations:
        - display_name: Istio Network
          label: topology_istio_io_network
        - display_name: Istio Revision
          label: istio_io_rev
      metrics_outbound:
        aggregations:
        - display_name: Istio Revision
          label: istio_io_rev
Notice that custom aggregations for inbound and outbound metrics are defined separately.
You can find some screenshots in Kiali v1.40 feature update blog post.
Default metrics duration and refresh interval
Most Kiali pages show metrics per refresh and refresh interval drop-downs. These are located at the top-right of the page.
Metrics per refresh specifies the time range back from the current instant to fetch metrics and/or distributed tracing data. By default, a 1-minute time range is selected.
Refresh interval specifies how often Kiali will automatically refresh the data shown. By default, Kiali refreshes data every 15 seconds.
spec:
  kiali_feature_flags:
    ui_defaults:
      # Valid values: 1m, 5m, 10m, 30m, 1h, 3h, 6h, 12h, 1d, 7d, 30d
      metrics_per_refresh: "1m"

      # Valid values: pause, 10s, 15s, 30s, 1m, 5m, 15m
      refresh_interval: "15s"
User selections won’t persist a reload.
Default namespace selection
By default, when Kiali is accessed by the first time, on most Kiali pages users will need to use the namespace drop-down to choose namespaces they want to view data from. The selection will be persisted on reloads.
However, it is possible to configure a predefined selection of namespaces, like in the following example:
spec:
  kiali_feature_flags:
    ui_defaults:
      namespaces:
      - istio-system
      - bookinfo
Namespace selection will reset to the predefined set on reloads. Also, if for some reason a namespace becomes deleted, Kiali will simply ignore it from the list.
Graph find and hide presets
In the toolbar of the topology graph, the Find and Hide textboxes can be configured with presets for your most used criteria. You can find screenshots and a brief description of this feature in the feature update blog post for versions 1.31 to 1.33.
The following are the default presets:
spec:
  kiali_feature_flags:
    ui_defaults:
      graph:
        find_options:
        - description: "Find: slow edges (> 1s)"
          expression: "rt > 1000"
        - description: "Find: unhealthy nodes"
          expression:  "! healthy"
        - description: "Find: unknown nodes"
          expression:  "name = unknown"
        hide_options:
        - description: "Hide: healthy nodes"
          expression: "healthy"
        - description: "Hide: unknown nodes"
          expression:  "name = unknown"
Hopefully, the attributes to configure this feature are self-explanatory.
Note that by providing your own presets, you will be overriding the default configuration. Make sure to include any default presets that you need in case you provide your own configuration.
Graph default traffic rates
Traffic rates in the graph are fetched from Istio telemetry and there are several metric sources that can be used.
In the graph page, you can select the traffic rate metrics using the Traffic drop-down (next to the Namespaces drop-down). By default, Requests is selected for GRPC and HTTP protocols, and Sent bytes is selected for the TCP protocol, but you can change the default selection:
spec:
  kiali_feature_flags:
    ui_defaults:
      graph:
        traffic:
          grpc: "requests" # Valid values: none, requests, sent, received and total
          http: "requests" # Valid values: none and requests
          tcp:  "sent"     # Valid values: none, sent, received and total
Note that only requests provide response codes and will allow health to be calculated. Also, the resulting topology graph may be different for each source.
2.3 - Custom Dashboards
Custom Dashboards require some configuration to work properly.
Declaring a custom dashboard
When installing Kiali, you define your own custom dashboards in the Kiali CR spec.custom_dashboards field. Here’s an example of what it looks like:
custom_dashboards:
- name: vertx-custom
  title: Vert.x Metrics
  runtime: Vert.x
  discoverOn: "vertx_http_server_connections"
  items:
  - chart:
      name: "Server response time"
      unit: "seconds"
      spans: 6
      metrics:
      - metricName: "vertx_http_server_responseTime_seconds"
        displayName: "Server response time"
      dataType: "histogram"
      aggregations:
      - label: "path"
        displayName: "Path"
      - label: "method"
        displayName: "Method"
  - chart:
      name: "Server active connections"
      unit: ""
      spans: 6
      metricName: "vertx_http_server_connections"
      dataType: "raw"
  - include: "micrometer-1.1-jvm"
  externalLinks:
  - name: "My custom Grafana dashboard"
    type: "grafana"
    variables:
      app: var-app
      namespace: var-namespace
      version: var-version
The name field corresponds to what you can set in the pod annotation kiali.io/dashboards.
The rest of the field definitions are:
- runtime: optional, name of the related runtime. It will be displayed on the corresponding Workload Details page. If omitted no name is displayed.
- title: dashboard title, displayed as a tab in Application or Workloads Details
- discoverOn: metric name to match for auto-discovery. If omitted, the dashboard won’t be discovered automatically, but can still be used via pods annotation.
- items: a list of items, that can be either chart, to define a new chart, or include to reference another dashboard
- chart: new chart object
- name: name of the chart
- chartType: type of the chart, can be one of line (default), area, bar or scatter
- unit: unit for Y-axis. Free-text field to provide any unit suffix. It can eventually be scaled on display. See specific section below.
- unitScale: in case the unit needs to be scaled by some factor, set that factor here. For instance, if your data is in milliseconds, set
0.001as scale andsecondsas unit. - spans: number of “spans” taken by the chart, from 1 to 12, using bootstrap convention
- metrics: a list of metrics to display on this single chart:
- metricName: the metric name in Prometheus
- displayName: name to display on chart
- dataType: type of data to be displayed in the chart. Can be one of raw, rate or histogram. Raw data will be queried without transformation. Rate data will be queried using promQL rate() function. And histogram with histogram_quantile() function.
- min and max: domain for Y-values. When unset, charts implementations should usually automatically adapt the domain with the displayed data.
- xAxis: type of the X-axis, can be one of time (default) or series. When set to series, only one datapoint per series will be displayed, and the chart type then defaults to bar.
- aggregator: defines how the time-series are aggregated when several are returned for a given metric and label set. For example, if a Deployment creates a ReplicaSet of several Pods, you will have at least one time-series per Pod. Since Kiali shows the dashboards at the workload (ReplicaSet) level or at the application level, they will have to be aggregated. This field can be used to fix the aggregator, with values such as sum or avg (full list available in Prometheus documentation). However, if omitted the aggregator will default to sum and can be changed from the dashboard UI.
- aggregations: list of labels eligible for aggregations / groupings (they will be displayed in Kiali through a dropdown list)
- label: Prometheus label name
- displayName: name to display in Kiali
- singleSelection: boolean flag to switch between single-selection and multi-selection modes on the values of this label. Defaults to false.
- groupLabels: a list of Prometheus labels to be used for grouping. Similar to aggregations, except this grouping will be always turned on.
- sortLabel: Prometheus label to be used for the metrics display order.
- sortLabelParseAs: set to int if sortLabel needs to be parsed and compared as an integer instead of string.
- include: to include another dashboard, or a specific chart from another dashboard. Typically used to compose with generic dashboards such as the ones about MicroProfile Metrics or Micrometer-based JVM metrics. To reference a full dashboard, set the name of that dashboard. To reference a specific chart of another dashboard, set the name of the dashboard followed by
$and the name of the chart (ex:include: "microprofile-1.1$Thread count").
- chart: new chart object
- externalLinks: a list of related external links (e.g. to Grafana dashboards)
- name: name of the related dashboard in the external system (e.g. name of a Grafana dashboard)
- type: link type, currently only grafana is allowed
- variables: a set of variables that can be injected in the URL. For instance, with something like namespace: var-namespace and app: var-app, an URL to a Grafana dashboard that manages namespace and app variables would look like:
http://grafana-server:3000/d/xyz/my-grafana-dashboard?var-namespace=some-namespace&var-app=some-app. The available variables in this context are namespace, app and version.
In Kiali, labels for grouping are aggregated in the top toolbar, so if the same label refers to different things depending on the metric, you wouldn’t be able to distinguish them in the UI. For that reason, ideally, labels should not have too generic names in Prometheus. For instance labels named “id” for both memory spaces and buffer pools would better be named “space_id” and “pool_id”. If you have control on label names, it’s an important aspect to take into consideration. Else, it is up to you to organize dashboards with that in mind, eventually splitting them into smaller ones to resolve clashes.
spec.custom_dashboards. Simply define a custom dashboard with the same name as the built-in dashboard. To remove a built-in dashboard so Kiali doesn’t use it, simply define a custom dashboard by defining only its name with no other data associated with it (e.g. in spec.custom_dashboards you add a list item that has - name: <name of built-in dashboard to remove>.
Dashboard scope
The custom dashboards defined in the Kiali CR are available for all workloads in all namespaces.
Additionally, new custom dashboards can be created for a given namespace or workload, using the dashboards.kiali.io/templates annotation.
This is an example where a “Custom Envoy” dashboard will be available for all applications and workloads for the default namespace:
apiVersion: v1
kind: Namespace
metadata:
  name: default
  annotations:
    dashboards.kiali.io/templates: |
      - name: custom_envoy
        title: Custom Envoy
        discoverOn: "envoy_server_uptime"
        items:
          - chart:
              name: "Pods uptime"
              spans: 12
              metricName: "envoy_server_uptime"
              dataType: "raw"
This other example will create an additional “Active Listeners” dashboard only on details-v1 workload:
apiVersion: apps/v1
kind: Deployment
metadata:
  name: details-v1
  labels:
    app: details
    version: v1
spec:
  replicas: 1
  selector:
    matchLabels:
      app: details
      version: v1
  template:
    metadata:
      labels:
        app: details
        version: v1
      annotations:
        dashboards.kiali.io/templates: |
          - name: envoy_listeners
            title: Active Listeners
            discoverOn: "envoy_listener_manager_total_listeners_active"
            items:
              - chart:
                  name: "Total Listeners"
                  spans: 12
                  metricName: "envoy_listener_manager_total_listeners_active"
                  dataType: "raw"
    spec:
      serviceAccountName: bookinfo-details
      containers:
      - name: details
        image: docker.io/istio/examples-bookinfo-details-v1:1.16.2
        imagePullPolicy: IfNotPresent
        ports:
        - containerPort: 9080
        securityContext:
          runAsUser: 1000
Units
Some units are recognized in Kiali and scaled appropriately when displayed on charts:
unit: "seconds"can be scaled down toms,µs, etc.unit: "bytes-si"andunit: "bitrate-si"can be scaled up tokB,MB(etc.) using SI / metric system. The aliasesunit: "bytes"andunit: "bitrate"can be used instead.unit: "bytes-iec"andunit: "bitrate-iec"can be scaled up toKiB,MiB(etc.) using IEC standard / IEEE 1541-2002 (scale by powers of 2).
Other units will fall into the default case and be scaled using SI standard. For instance, unit: "m" for meter can be scaled up to km.
Prometheus Configuration
Kiali custom dashboards work exclusively with Prometheus, so it must be configured correctly to pull your application metrics.
If you are using the demo Istio installation with addons, your Prometheus instance should already be correctly configured and you can skip to the next section; with the exception of Istio 1.6.x where
you need customize the ConfigMap, or install Istio with the flag --set meshConfig.enablePrometheusMerge=true.
Using another Prometheus instance
You can use a different instance of Prometheus for these metrics, as opposed to Istio metrics. This second Prometheus instance can be configured from the Kiali CR when using the Kiali operator, or ConfigMap otherwise:
# ...
external_services:
  custom_dashboards:
    prometheus:
      url: URL_TO_PROMETHEUS_SERVER_FOR_CUSTOM_DASHBOARDS
    namespace_label: kubernetes_namespace
  prometheus:
    url: URL_TO_PROMETHEUS_SERVER_FOR_ISTIO_METRICS
# ...
For more details on this configuration, such as Prometheus authentication options, check the Kiali CR Reference page.
You must make sure that this Prometheus instance is correctly configured to scrape your application pods and generates labels that Kiali will understand. Please refer to
this documentation to setup the kubernetes_sd_config section. As a reference,
here is how it is configured in Istio.
It is important to preserve label mapping, so that Kiali can filter by app and version, and to have the same namespace label as defined per Kiali config. Here’s a relabel_configs that allows this:
      relabel_configs:
      - action: labelmap
        regex: __meta_kubernetes_pod_label_(.+)
      - source_labels: [__meta_kubernetes_namespace]
        action: replace
        target_label: kubernetes_namespace
Pod Annotations and Auto-discovery
Application pods must be annotated for the Prometheus scraper, for example, within a Deployment definition:
spec:
  template:
    metadata:
      annotations:
        prometheus.io/scrape: "true"
        prometheus.io/port: "8080"
        prometheus.io/path: "/metrics"
- prometheus.io/scrape tells Prometheus to fetch these metrics or not
- prometheus.io/port is the port under which metrics are exposed
- prometheus.io/path is the endpoint path where metrics are exposed, default is /metrics
Kiali will try to discover automatically dashboards that are relevant for a given Application or Workload. To do so, it reads their metrics and try to match them with the discoverOn field defined on dashboards.
But if you can’t rely on automatic discovery, you can explicitly annotate the pods to associate them with Kiali dashboards.
spec:
  template:
    metadata:
      annotations:
        # (prometheus annotations...)
        kiali.io/dashboards: vertx-server
kiali.io/dashboards is a comma-separated list of dashboard names that Kiali will look for. Each name in the list must match the name of a built-in dashboard or the name of a custom dashboard as defined in the Kial CR’s spec.custom_dashboards.
2.4 - Istio Environment
Labels and resource names
Istio recommends adding app and version labels to
pods to attach this information to telemetry. Kiali relies on correctness of these labels for several features.
In Istio, it is possible to use a different set of labels, like
app.kubernetes.io/name and app.kubernetes.io/version, however you must
configure Kiali to the labels you are using. By default, Kiali uses Istio’s
recommended labels:
spec:
  istio_labels:
    app_label_name: "app"
    version_label_name: "version"
Although Istio lets you use different labels on different pods, Kiali can only use a single set.
For example, Istio lets you use the app label in one pod and the
app.kubernetes.io/name in another pod and it will generate telemetry
correctly. However, you will have no way to configure Kiali for this case.
Monitoring port of the IstioD pod
Kiali connects directly to the IstioD pod (not the Service) to check for its health. By default, the connection is done to port 15014 which is the default monitoring port of the IstioD pod.
Under some circumstances, you may need to change the monitoring port of the IstioD pod to something else. For example, when running IstioD in host network mode the network is shared between several pods, requiring to change listening ports of some pods to prevent conflicts.
It is possible to map the newly chosen monitoring port of the IstioD pod in the related Service to let other services continue working normally. However, since Kiali connects directly to the IstioD pod, you need to configure the assigned monitoring port in the Kiali CR:
spec:
  external_services:
    istio:
      istiod_pod_monitoring_port: 15014
Multi-cluster support
Kiali has experimental support for Istio multi-cluster installations using the multi-primary on different networks pattern. This support is enabled by default, but requires the Kiali ServiceAccount to have read access to secrets in the Istio namespace. If you don’t have a multi-cluster setup or don’t want Kiali to have read access to secrets in the Istio namespace, you can disable clustering support:
spec:
  kiali_feature_flags:
    clustering:
      enabled: false
Root namespace
Istio’s root namespace is the namespace where you can create some resources to define default Istio configurations and adapt Istio behavior to your environment. For more information on this Istio configuration, check the Istio docs Global Mesh options page and search for “rootNamespace”.
Kiali uses the root namespace for some of the validations of Istio resources. If you customized the Istio root namespace, you will need to replicate that configuration in Kiali. By default, it is unset:
spec:
  external_services:
    istio:
      root_namespace: ""
Sidecar injection, canary upgrade management and Istio revisions
Kiali can assist into configuring automatic sidecar injection, and also can assist when you are migrating workloads from an old Istio version to a newer one using the canary upgrade method. Kiali uses the standard Istio labels to control sidecar injection policy and canary upgrades.
Management of sidecar injection is enabled by default. If you don’t want this feature, you can disable it with the following configuration:
spec:
  kiali_feature_flags:
    istio_injection_action: false
Assistance for migrating workloads between Istio revisions when doing a canary upgrade is turned off by default. This is because it is required to know what is the revision name that was used when installing each Istio control plane. You can enable and configure the canary upgrade support with the following configuration:
spec:
  external_services:
    istio:
      istio_canary_revision:
        # Revision string of old Istio version
        current: "1-10-3"
        # Revision string of new Istio version
        upgrade: "1-11-0"
  kiali_feature_flags:
    # Turns on canary upgrade support
    istio_upgrade_action: true
It is important to note that canary upgrades require adding a revision name
during the installation of control planes. You will notice that the revision
name will be appended to the name of Istio resources. Thus, once/if you are
using Kiali with an Istio control plane that has a revision name you will need
to specify what is the name of a few Istio resources that Kiali uses. For
example, if your control plane has a revision name 1-11-0 you would need to
set these configurations:
spec:
  external_services:
    istio:
      config_map_name: "istio-1-11-0"
      istio_sidecar_injector_config_map_name: "istio-sidecar-injector-1-11-0"
      istiod_deployment_name: "istiod-1-11-0"
There following are links to sections of Kiali blogs posts that briefly explains these features:
2.5 - Kiali CR Reference
Example CR
(all values shown here are the defaults unless otherwise noted)apiVersion: kiali.io/v1alpha1
kind: Kiali
metadata:
name: kiali
annotations:
ansible.sdk.operatorframework.io/verbosity: "1"
spec:
additional_display_details:
- title: "API Documentation"
annotation: "kiali.io/api-spec"
icon_annotation: "kiali.io/api-type"
installation_tag: ""
istio_namespace: ""
version: "default"
api:
namespaces:
exclude:
- "^istio-operator"
- "^kube-.*"
- "^openshift.*"
- "^ibm.*"
- "^kiali-operator"
# default: label_selector is undefined
label_selector: "kiali.io/member-of=istio-system"
auth:
strategy: ""
openid:
# default: additional_request_params is empty
additional_request_params:
openIdReqParam: "openIdReqParamValue"
# default: allowed_domains is an empty list
allowed_domains: ["allowed.domain"]
api_proxy: ""
api_proxy_ca_data: ""
api_token: "id_token"
authentication_timeout: 300
authorization_endpoint: ""
client_id: ""
disable_rbac: false
http_proxy: ""
https_proxy: ""
insecure_skip_verify_tls: false
issuer_uri: ""
scopes: ["openid", "profile", "email"]
username_claim: "sub"
openshift:
client_id_prefix: "kiali"
# default: custom_dashboards is an empty list
custom_dashboards:
- name: "envoy"
deployment:
accessible_namespaces: ["^((?!(istio-operator|kube-.*|openshift.*|ibm.*|kiali-operator)).)*$"]
# default: additional_service_yaml is empty
additional_service_yaml:
externalName: "kiali.example.com"
affinity:
# default: node is empty
node:
requiredDuringSchedulingIgnoredDuringExecution:
nodeSelectorTerms:
- matchExpressions:
- key: kubernetes.io/e2e-az-name
operator: In
values:
- e2e-az1
- e2e-az2
# default: pod is empty
pod:
requiredDuringSchedulingIgnoredDuringExecution:
- labelSelector:
matchExpressions:
- key: security
operator: In
values:
- S1
topologyKey: topology.kubernetes.io/zone
# default: pod_anti is empty
pod_anti:
preferredDuringSchedulingIgnoredDuringExecution:
- weight: 100
podAffinityTerm:
labelSelector:
matchExpressions:
- key: security
operator: In
values:
- S2
topologyKey: topology.kubernetes.io/zone
# default: configmap_annotations is empty
configmap_annotations:
strategy.spinnaker.io/versioned: "false"
# default: custom_secrets is an empty list
custom_secrets:
- name: "a-custom-secret"
mount: "/a-custom-secret-path"
optional: true
hpa:
api_version: ""
# default: spec is empty
spec:
maxReplicas: 2
minReplicas: 1
metrics:
- type: Resource
resource:
name: cpu
target:
type: Utilization
averageUtilization: 50
# default: host_aliases is an empty list
host_aliases:
- ip: "192.168.1.100"
hostnames:
- "foo.local"
- "bar.local"
image_digest: ""
image_name: ""
image_pull_policy: "IfNotPresent"
# default: image_pull_secrets is an empty list
image_pull_secrets: ["image.pull.secret"]
image_version: ""
ingress:
# default: additional_labels is empty
additional_labels:
ingressAdditionalLabel: "ingressAdditionalLabelValue"
class_name: "nginx"
# default: enabled is undefined
enabled: false
# default: override_yaml is undefined
override_yaml:
metadata:
annotations:
nginx.ingress.kubernetes.io/secure-backends: "true"
nginx.ingress.kubernetes.io/backend-protocol: "HTTPS"
spec:
rules:
- http:
paths:
- path: "/kiali"
pathType: Prefix
backend:
service:
name: "kiali"
port:
number: 20001
instance_name: "kiali"
logger:
log_level: "info"
log_format: "text"
sampler_rate: "1"
time_field_format: "2006-01-02T15:04:05Z07:00"
namespace: "istio-system"
# default: node_selector is empty
node_selector:
nodeSelector: "nodeSelectorValue"
# default: pod_annotations is empty
pod_annotations:
podAnnotation: "podAnnotationValue"
# default: pod_labels is empty
pod_labels:
sidecar.istio.io/inject: "true"
priority_class_name: ""
replicas: 1
# default: resources is undefined
resources:
requests:
cpu: "10m"
memory: "64Mi"
limits:
memory: "1Gi"
secret_name: "kiali"
# default: service_annotations is empty
service_annotations:
svcAnnotation: "svcAnnotationValue"
# default: service_type is undefined
service_type: "NodePort"
# default: tolerations is an empty list
tolerations:
- key: "example-key"
operator: "Exists"
effect: "NoSchedule"
verbose_mode: "3"
version_label: ""
view_only_mode: false
external_services:
custom_dashboards:
discovery_auto_threshold: 10
discovery_enabled: "auto"
enabled: true
is_core: false
namespace_label: "namespace"
prometheus:
auth:
ca_file: ""
insecure_skip_verify: false
password: ""
token: ""
type: "none"
use_kiali_token: false
username: ""
cache_duration: 10
cache_enabled: true
cache_expiration: 300
# default: custom_headers is empty
custom_headers:
customHeader1: "customHeader1Value"
health_check_url: ""
is_core: true
# default: query_scope is empty
query_scope:
mesh_id: "mesh-1"
cluster: "cluster-east"
thanos_proxy:
enabled: false
retention_period: "7d"
scrape_interval: "30s"
url: ""
grafana:
auth:
ca_file: ""
insecure_skip_verify: false
password: ""
token: ""
type: "none"
use_kiali_token: false
username: ""
dashboards:
- name: "Istio Service Dashboard"
variables:
namespace: "var-namespace"
service: "var-service"
- name: "Istio Workload Dashboard"
variables:
namespace: "var-namespace"
workload: "var-workload"
- name: "Istio Mesh Dashboard"
- name: "Istio Control Plane Dashboard"
- name: "Istio Performance Dashboard"
- name: "Istio Wasm Extension Dashboard"
enabled: true
health_check_url: ""
# default: in_cluster_url is undefined
in_cluster_url: ""
is_core: false
url: ""
istio:
component_status:
components:
- app_label: "istiod"
is_core: true
is_proxy: false
- app_label: "istio-ingressgateway"
is_core: true
is_proxy: true
# default: namespace is undefined
namespace: istio-system
- app_label: "istio-egressgateway"
is_core: false
is_proxy: true
# default: namespace is undefined
namespace: istio-system
enabled: true
config_map_name: "istio"
envoy_admin_local_port: 15000
# default: istio_canary_revision is undefined
istio_canary_revision:
current: "1-9-9"
upgrade: "1-10-2"
istio_identity_domain: "svc.cluster.local"
istio_injection_annotation: "sidecar.istio.io/inject"
istio_sidecar_annotation: "sidecar.istio.io/status"
istio_sidecar_injector_config_map_name: "istio-sidecar-injector"
istiod_deployment_name: "istiod"
istiod_pod_monitoring_port: 15014
root_namespace: ""
url_service_version: ""
prometheus:
auth:
ca_file: ""
insecure_skip_verify: false
password: ""
token: ""
type: "none"
use_kiali_token: false
username: ""
cache_duration: 10
cache_enabled: true
cache_expiration: 300
# default: custom_headers is empty
custom_headers:
customHeader1: "customHeader1Value"
health_check_url: ""
is_core: true
# default: query_scope is empty
query_scope:
mesh_id: "mesh-1"
cluster: "cluster-east"
thanos_proxy:
enabled: false
retention_period: "7d"
scrape_interval: "30s"
url: ""
tracing:
auth:
ca_file: ""
insecure_skip_verify: false
password: ""
token: ""
type: "none"
use_kiali_token: false
username: ""
enabled: true
in_cluster_url: ""
is_core: false
namespace_selector: true
# default: query_scope is empty
query_scope:
mesh_id: "mesh-1"
cluster: "cluster-east"
url: ""
use_grpc: true
whitelist_istio_system: ["jaeger-query", "istio-ingressgateway"]
health_config:
# default: rate is an empty list
rate:
- namespace: ".*"
kind: ".*"
name: ".*"
tolerance:
- protocol: "http"
direction: ".*"
code: "[1234]00"
degraded: 5
failure: 10
identity:
# default: cert_file is undefined
cert_file: ""
# default: private_key_file is undefined
private_key_file: ""
istio_labels:
app_label_name: "app"
injection_label_name: "istio-injection"
injection_label_rev: "istio.io/rev"
version_label_name: "version"
kiali_feature_flags:
certificates_information_indicators:
enabled: true
secrets:
- "cacerts"
- "istio-ca-secret"
clustering:
enabled: true
disabled_features: []
istio_injection_action: true
istio_upgrade_action: false
ui_defaults:
graph:
find_options:
- description: "Find: slow edges (> 1s)"
expression: "rt > 1000"
- description: "Find: unhealthy nodes"
expression: "! healthy"
- description: "Find: unknown nodes"
expression: "name = unknown"
hide_options:
- description: "Hide: healthy nodes"
expression: "healthy"
- description: "Hide: unknown nodes"
expression: "name = unknown"
traffic:
grpc: "requests"
http: "requests"
tcp: "sent"
metrics_per_refresh: "1m"
# default: metrics_inbound is undefined
metrics_inbound:
aggregations:
- display_name: "Istio Network"
label: "topology_istio_io_network"
- display_name: "Istio Revision"
label: "istio_io_rev"
# default: metrics_outbound is undefined
metrics_outbound:
aggregations:
- display_name: "Istio Network"
label: "topology_istio_io_network"
- display_name: "Istio Revision"
label: "istio_io_rev"
# default: namespaces is an empty list
namespaces: ["istio-system"]
refresh_interval: "60s"
validations:
ignore: ["KIA1201"]
kubernetes_config:
burst: 200
cache_duration: 300
cache_enabled: true
cache_istio_types:
- "AuthorizationPolicy"
- "DestinationRule"
- "EnvoyFilter"
- "Gateway"
- "PeerAuthentication"
- "RequestAuthentication"
- "ServiceEntry"
- "Sidecar"
- "VirtualService"
- "WorkloadEntry"
- "WorkloadGroup"
cache_namespaces:
- ".*"
cache_token_namespace_duration: 10
excluded_workloads:
- "CronJob"
- "DeploymentConfig"
- "Job"
- "ReplicationController"
qps: 175
login_token:
expiration_seconds: 86400
signing_key: ""
server:
address: ""
audit_log: true
cors_allow_all: false
gzip_enabled: true
observability:
metrics:
enabled: true
port: 9090
tracing:
collector_url: "http://jaeger-collector.istio-system:14268/api/traces"
enabled: false
port: 20001
web_fqdn: ""
web_history_mode: ""
web_port: ""
web_root: ""
web_schema: ""
Validating your Kiali CR
A Kiali tool is available to allow you to check your own Kiali CR to ensure it is valid. Simply download the validation script and run it, passing in the location of the Kiali CRD you wish to validate with (e.g. the latest version is found here) and the location of your Kiali CR. You must be connected to/logged into a cluster for this validation tool to work.
For example, to validate a Kiali CR named kiali in the namespace istio-system using the latest version of the Kiali CRD, run the following:
bash <(curl -sL https://raw.githubusercontent.com/kiali/kiali-operator/master/crd-docs/bin/validate-kiali-cr.sh) \
  -crd https://raw.githubusercontent.com/kiali/kiali-operator/master/crd-docs/crd/kiali.io_kialis.yaml \
  --kiali-cr-name kiali \
  -n istio-system
If you wish to test your Kiali CR with an older version of Kiali, replace master in the above -crd option with the version you wish to test. For example, to test your Kiali CR with Kiali version v1.53.0, pass in the option -crd https://raw.githubusercontent.com/kiali/kiali-operator/v1.53.0/crd-docs/crd/kiali.io_kialis.yaml in the above command.
For additional help in using this validation tool, pass it the --help option.
Properties
.spec
This is the CRD for the resources called Kiali CRs. The Kiali Operator will watch for resources of this type and when it detects a Kiali CR has been added, deleted, or modified, it will install, uninstall, and update the associated Kiali Server installation. The settings here will configure the Kiali Server as well as the Kiali Operator. All of these settings will be stored in the Kiali ConfigMap. Do not modify the ConfigMap; it will be managed by the Kiali Operator. Only modify the Kiali CR when you want to change a configuration setting.
.spec.additional_display_details
A list of additional details that Kiali will look for in annotations. When found on any workload or service, Kiali will display the additional details in the respective workload or service details page. This is typically used to inject some CI metadata or documentation links into Kiali views. For example, by default, Kiali will recognize these annotations on a service or workload (e.g. a Deployment, StatefulSet, etc.):
annotations:
  kiali.io/api-spec: http://list/to/my/api/doc
  kiali.io/api-type: rest
Note that if you change this setting for your own custom annotations, keep in mind that it would override the current default. So you would have to add the default setting as shown in the example CR if you want to preserve the default links.
.spec.additional_display_details[*]
.spec.additional_display_details[*].annotation
The name of the annotation whose value is a URL to additional documentation useful to the user.
.spec.additional_display_details[*].icon_annotation
The name of the annotation whose value is used to determine what icon to display. The annotation name itself can be anything, but note that the value of that annotation must be one of: rest, grpc, and graphql - any other value is ignored.
.spec.additional_display_details[*].title
The title of the link that Kiali will display. The link will go to the URL specified in the value of the configured annotation.
.spec.api
.spec.api.namespaces
Settings that control what namespaces are returned by Kiali.
.spec.api.namespaces.exclude
A list of namespaces to be excluded from the list of namespaces provided by the Kiali API and Kiali UI. Regex is supported. This does not affect explicit namespace access.
.spec.api.namespaces.exclude[*]
.spec.api.namespaces.label_selector
A Kubernetes label selector (e.g. myLabel=myValue) which is used when fetching the list of
available namespaces. This does not affect explicit namespace access.
If deployment.accessible_namespaces does not have the special value of '**'
then the Kiali operator will add a new label to all accessible namespaces - that new
label will be this label_selector.
Note that if you do not set this label_selector setting but deployment.accessible_namespaces
does not have the special “all namespaces” entry of '**' then this label_selector will be set
to a default value of kiali.io/[<deployment.instance_name>.]member-of=<deployment.namespace>
where [<deployment.instance_name>.] is the instance name assigned to the Kiali installation
if it is not the default ‘kiali’ (otherwise, this is omitted) and <deployment.namespace>
is the namespace where Kiali is to be installed.
.spec.auth
.spec.auth.openid
To learn more about these settings and how to configure the OpenId authentication strategy, read the documentation at https://kiali.io/docs/configuration/authentication/openid/
.spec.auth.openid.additional_request_params
.spec.auth.openid.allowed_domains
.spec.auth.openid.allowed_domains[*]
.spec.auth.openid.api_proxy
.spec.auth.openid.api_proxy_ca_data
.spec.auth.openid.api_token
.spec.auth.openid.authentication_timeout
.spec.auth.openid.authorization_endpoint
.spec.auth.openid.client_id
.spec.auth.openid.disable_rbac
.spec.auth.openid.http_proxy
.spec.auth.openid.https_proxy
.spec.auth.openid.insecure_skip_verify_tls
.spec.auth.openid.issuer_uri
.spec.auth.openid.scopes
.spec.auth.openid.scopes[*]
.spec.auth.openid.username_claim
.spec.auth.openshift
To learn more about these settings and how to configure the OpenShift authentication strategy, read the documentation at https://kiali.io/docs/configuration/authentication/openshift/
.spec.auth.openshift.client_id_prefix
The Route resource name and OAuthClient resource name will have this value as its prefix. This value normally should never change. The installer will ensure this value is set correctly.
.spec.auth.strategy
Determines what authentication strategy to use when users log into Kiali.
Options are anonymous, token, openshift, openid, or header.
- Choose
anonymousto allow full access to Kiali without requiring any credentials. - Choose
tokento allow access to Kiali using service account tokens, which controls access based on RBAC roles assigned to the service account. - Choose
openshiftto use the OpenShift OAuth login which controls access based on the individual’s RBAC roles in OpenShift. Not valid for non-OpenShift environments. - Choose
openidto enable OpenID Connect-based authentication. Your cluster is required to be configured to accept the tokens issued by your IdP. There are additional required configurations for this strategy. See below for the additional OpenID configuration section. - Choose
headerwhen Kiali is running behind a reverse proxy that will inject an Authorization header and potentially impersonation headers.
When empty, this value will default to openshift on OpenShift and token on other Kubernetes environments.
.spec.custom_dashboards
A list of user-defined custom monitoring dashboards that you can use to generate metrics charts for your applications. The server has some built-in dashboards; if you define a custom dashboard here with the same name as a built-in dashboard, your custom dashboard takes precedence and will overwrite the built-in dashboard. You can disable one or more of the built-in dashboards by simply defining an empty dashboard.
An example of an additional user-defined dashboard,
- name: myapp
  title: My App Metrics
  items:
  - chart:
      name: "Thread Count"
      spans: 4
      metricName: "thread-count"
      dataType: "raw"
An example of disabling a built-in dashboard (in this case, disabling the Envoy dashboard),
- name: envoy
To learn more about custom monitoring dashboards, see the documentation at https://kiali.io/docs/configuration/custom-dashboard/
.spec.custom_dashboards[*]
.spec.deployment
.spec.deployment.accessible_namespaces
A list of namespaces Kiali is to be given access to. These namespaces have service mesh components that are to be observed by Kiali. You can provide names using regex expressions matched against all namespaces the operator can see. The default makes all namespaces accessible except for some internal namespaces that typically should be ignored. NOTE! If this has an entry with the special value of '**' (two asterisks), that will denote you want Kiali to be given access to all namespaces via a single cluster role (if using this special value of '**', you are required to have already granted the operator permissions to create cluster roles and cluster role bindings).
.spec.deployment.accessible_namespaces[*]
.spec.deployment.additional_service_yaml
Additional custom yaml to add to the service definition. This is used mainly to customize the service type. For example, if the deployment.service_type is set to ‘LoadBalancer’ and you want to set the loadBalancerIP, you can do so here with: additional_service_yaml: { 'loadBalancerIP': '78.11.24.19' }. Another example would be if the deployment.service_type is set to ‘ExternalName’ you will need to configure the name via: additional_service_yaml: { 'externalName': 'my.kiali.example.com' }. A final example would be if external IPs need to be set: additional_service_yaml: { 'externalIPs': ['80.11.12.10'] }
.spec.deployment.affinity
Affinity definitions that are to be used to define the nodes where the Kiali pod should be constrained. See the Kubernetes documentation on Assigning Pods to Nodes for the proper syntax for these three different affinity types.
.spec.deployment.affinity.node
.spec.deployment.affinity.pod
.spec.deployment.affinity.pod_anti
.spec.deployment.configmap_annotations
Custom annotations to be created on the Kiali ConfigMap.
.spec.deployment.custom_secrets
Defines additional secrets that are to be mounted in the Kiali pod.
These are useful to contain certs that are used by Kiali to securely connect to third party systems
(for example, see external_services.tracing.auth.ca_file).
These secrets must be created by an external mechanism. Kiali will not generate these secrets; it is assumed these secrets are externally managed. You can define 0, 1, or more secrets. An example configuration is,
custom_secrets:
- name: mysecret
  mount: /mysecret-path
- name: my-other-secret
  mount: /my-other-secret-location
  optional: true
.spec.deployment.custom_secrets[*]
.spec.deployment.custom_secrets[*].mount
The file path location where the secret content will be mounted. The custom secret cannot be mounted on a path that the operator will use to mount its secrets. Make sure you set your custom secret mount path to a unique, unused path. Paths such as /kiali-configuration, /kiali-cert, /kiali-cabundle, and /kiali-secret should not be used as mount paths for custom secrets because the operator may want to use one of those paths.
.spec.deployment.custom_secrets[*].name
The name of the secret that is to be mounted to the Kiali pod’s file system. The name of the custom secret must not be the same name as one created by the operator. Names such as kiali, kiali-cert-secret, and kiali-cabundle should not be used as a custom secret name because the operator may want to create one with one of those names.
.spec.deployment.custom_secrets[*].optional
Indicates if the secret may or may not exist at the time the Kiali pod starts. This will default to ‘false’ if not specified.
.spec.deployment.host_aliases
This is content for the Kubernetes ‘hostAliases’ setting for the Kiali server. This allows you to modify the Kiali server pod ‘/etc/hosts’ file. A typical way to configure this setting is,
host_aliases:
- ip: 192.168.1.100
  hostnames:
  - "foo.local"
  - "bar.local"
For details on the content of this setting, see https://kubernetes.io/docs/tasks/network/customize-hosts-file-for-pods/#adding-additional-entries-with-hostaliases
.spec.deployment.host_aliases[*]
.spec.deployment.host_aliases[*].hostnames
.spec.deployment.host_aliases[*].hostnames[*]
.spec.deployment.host_aliases[*].ip
.spec.deployment.hpa
Determines what (if any) HorizontalPodAutoscaler should be created to autoscale the Kiali pod. A typical way to configure HPA for Kiali is,
hpa:
  api_version: "autoscaling/v2"
  spec:
    maxReplicas: 2
    minReplicas: 1
    metrics:
    - type: Resource
      resource:
        name: cpu
        target:
          type: Utilization
          averageUtilization: 50
.spec.deployment.hpa.api_version
A specific HPA API version that can be specified in case there is some HPA feature you want to use that is only supported in that specific version. If value is an empty string, an attempt will be made to determine a valid version.
.spec.deployment.hpa.spec
The spec specified here will be placed in the created HPA resource’s ‘spec’ section. If spec is left empty, no HPA resource will be created. Note that you must not specify the ‘scaleTargetRef’ section in spec; the Kiali Operator will populate that for you.
.spec.deployment.image_digest
If deployment.image_version is a digest hash, this value indicates what type of digest it is. A typical value would be ‘sha256’. Note: do NOT prefix this value with a ‘@’.
.spec.deployment.image_name
Determines which Kiali image to download and install. If you set this to a specific name (i.e. you do not leave it as the default empty string), you must make sure that image is supported by the operator. If empty, the operator will use a known supported image name based on which version was defined. Note that, as a security measure, a cluster admin may have configured the Kiali operator to ignore this setting. A cluster admin may do this to ensure the Kiali operator only installs a single, specific Kiali version, thus this setting may have no effect depending on how the operator itself was configured.
.spec.deployment.image_pull_policy
The Kubernetes pull policy for the Kiali deployment. This is overridden to be ‘Always’ if deployment.image_version is set to ‘latest’.
.spec.deployment.image_pull_secrets
The names of the secrets to be used when container images are to be pulled.
.spec.deployment.image_pull_secrets[*]
.spec.deployment.image_version
Determines which version of Kiali to install.
Choose ‘lastrelease’ to use the last Kiali release.
Choose ‘latest’ to use the latest image (which may or may not be a released version of Kiali).
Choose ‘operator_version’ to use the image whose version is the same as the operator version.
Otherwise, you can set this to any valid Kiali version (such as ‘v1.0’) or any valid Kiali
digest hash (if you set this to a digest hash, you must indicate the digest in deployment.image_digest).
Note that if this is set to ‘latest’ then the deployment.image_pull_policy will be set to ‘Always’.
If you set this to a specific version (i.e. you do not leave it as the default empty string), you must make sure that image is supported by the operator.
If empty, the operator will use a known supported image version based on which ‘version’ was defined. Note that, as a security measure, a cluster admin may have configured the Kiali operator to ignore this setting. A cluster admin may do this to ensure the Kiali operator only installs a single, specific Kiali version, thus this setting may have no effect depending on how the operator itself was configured.
.spec.deployment.ingress
Configures if/how the Kiali endpoint should be exposed externally.
.spec.deployment.ingress.additional_labels
Additional labels to add to the Ingress (or Route if on OpenShift). These are added to the labels that are created by default; these do not override the default labels.
.spec.deployment.ingress.class_name
If class_name is a non-empty string, it will be used as the ‘spec.ingressClassName’ in the created Kubernetes Ingress resource. This setting is ignored if on OpenShift. This is also ignored if override_yaml.spec is defined (i.e. you must define the ‘ingressClassName’ directly in your override yaml).
.spec.deployment.ingress.enabled
Determines if the Kiali endpoint should be exposed externally. If ‘true’, an Ingress will be created if on Kubernetes or a Route if on OpenShift. If left undefined, this will be ‘false’ on Kubernetes and ‘true’ on OpenShift.
.spec.deployment.ingress.override_yaml
Because an Ingress into a cluster can vary wildly in its desired configuration, this setting provides a way to override complete portions of the Ingress resource configuration (Ingress on Kubernetes and Route on OpenShift). It is up to the user to ensure this override YAML configuration is valid and supports the cluster environment since the operator will blindly copy this custom configuration into the resource it creates.
This setting is not used if deployment.ingress.enabled is set to ‘false’.
Note that only ‘metadata.annotations’ and ‘spec’ is valid and only they will
be used to override those same sections in the created resource. You can define
either one or both.
Note that override_yaml.metadata.labels is not allowed - you cannot override the labels; to add
labels to the default set of labels, use the deployment.ingress.additional_labels setting.
Example,
override_yaml:
  metadata:
    annotations:
      nginx.ingress.kubernetes.io/secure-backends: "true"
      nginx.ingress.kubernetes.io/backend-protocol: "HTTPS"
  spec:
    rules:
    - http:
        paths:
        - path: /kiali
          pathType: Prefix
          backend:
            service
              name: "kiali"
              port:
                number: 20001
.spec.deployment.ingress.override_yaml.metadata
.spec.deployment.ingress.override_yaml.metadata.annotations
.spec.deployment.ingress.override_yaml.spec
.spec.deployment.instance_name
The instance name of this Kiali installation. This instance name will be the prefix prepended to the names of all Kiali resources created by the operator and will be used to label those resources as belonging to this Kiali installation instance. You cannot change this instance name after a Kiali CR is created. If you attempt to change it, the operator will abort with an error. If you want to change it, you must first delete the original Kiali CR and create a new one. Note that this does not affect the name of the auto-generated signing key secret. If you do not supply a signing key, the operator will create one for you in a secret, but that secret will always be named ‘kiali-signing-key’ and shared across all Kiali instances in the same deployment namespace. If you want a different signing key secret, you are free to create your own and tell the operator about it via login_token.signing_key. See the docs on that setting for more details. Note also that if you are setting this value, you may also want to change the installation_tag setting, but this is not required.
.spec.deployment.logger
Configures the logger that emits messages to the Kiali server pod logs.
.spec.deployment.logger.log_format
Indicates if the logs should be written with one log message per line or using a JSON format. Must be one of: text or json.
.spec.deployment.logger.log_level
The lowest priority of messages to log. Must be one of: trace, debug, info, warn, error, or fatal.
.spec.deployment.logger.sampler_rate
With this setting every sampler_rate-th message will be logged. By default, every message is logged. As an example, setting this to '2' means every other message will be logged. The value of this setting is a string but must be parsable as an integer.
.spec.deployment.logger.time_field_format
The log message timestamp format. This supports a golang time format (see https://golang.org/pkg/time/)
.spec.deployment.namespace
The namespace into which Kiali is to be installed. If this is empty or not defined, the default will be the namespace where the Kiali CR is located.
.spec.deployment.node_selector
A set of node labels that dictate onto which node the Kiali pod will be deployed.
.spec.deployment.pod_annotations
Custom annotations to be created on the Kiali pod.
.spec.deployment.pod_labels
Custom labels to be created on the Kiali pod. An example use for this setting is to inject an Istio sidecar such as,
sidecar.istio.io/inject: "true"
.spec.deployment.priority_class_name
The priorityClassName used to assign the priority of the Kiali pod.
.spec.deployment.replicas
The replica count for the Kiail deployment.
.spec.deployment.resources
Defines compute resources that are to be given to the Kiali pod’s container. The value is a dict as defined by Kubernetes. See the Kubernetes documentation (https://kubernetes.io/docs/concepts/configuration/manage-compute-resources-container).
If you set this to an empty dict ({}) then no resources will be defined in the Deployment.
If you do not set this at all, the default is,
requests:
  cpu: "10m"
  memory: "64Mi"
limits:
  memory: "1Gi"
.spec.deployment.secret_name
The name of a secret used by the Kiali. This secret is optionally used when configuring the OpenID authentication strategy. Consult the OpenID docs for more information at https://kiali.io/docs/configuration/authentication/openid/
.spec.deployment.service_annotations
Custom annotations to be created on the Kiali Service resource.
.spec.deployment.service_type
The Kiali service type. Kubernetes determines what values are valid. Common values are ‘NodePort’, ‘ClusterIP’, and ‘LoadBalancer’.
.spec.deployment.tolerations
A list of tolerations which declare which node taints Kiali can tolerate. See the Kubernetes documentation on Taints and Tolerations for more details.
.spec.deployment.tolerations[*]
.spec.deployment.verbose_mode
DEPRECATED! Determines which priority levels of log messages Kiali will output. Use deployment.logger settings instead.
.spec.deployment.version_label
Kiali resources will be assigned a ‘version’ label when they are deployed. This setting determines what value those ‘version’ labels will have. When empty, its default will be determined as follows,
- If
deployment.image_versionis ‘latest’,version_labelwill be fixed to ‘master’. - If
deployment.image_versionis ‘lastrelease’,version_labelwill be fixed to the last Kiali release version string. - If
deployment.image_versionis anything else,version_labelwill be that value, too.
.spec.deployment.view_only_mode
When true, Kiali will be in ‘view only’ mode, allowing the user to view and retrieve management and monitoring data for the service mesh, but not allow the user to modify the service mesh.
.spec.external_services
These external service configuration settings define how to connect to the external services like Prometheus, Grafana, and Jaeger.
Regarding sensitive values in the external_services ‘auth’ sections:
Some external services configured below support an ‘auth’ sub-section in order to tell Kiali
how it should authenticate with the external services. Credentials used to authenticate Kiali
to those external services can be defined in the auth.password and auth.token values
within the auth sub-section. Because these are sensitive values, you may not want to declare
the actual credentials here in the Kiali CR. In this case, you may store the actual password
or token string in a Kubernetes secret. If you do, you need to set the auth.password or
auth.token to a value in the format secret:<secretName>:<secretKey> where <secretName>
is the name of the secret object that Kiali can access, and <secretKey> is the name of the
key within the named secret that contains the actual password or token string. For example,
if Grafana requires a password, you can store that password in a secret named ‘myGrafanaCredentials’
in a key named ‘myGrafanaPw’. In this case, you would set external_services.grafana.auth.password
to secret:myGrafanaCredentials:myGrafanaPw.
.spec.external_services.custom_dashboards
Settings for enabling and discovering custom dashboards.
.spec.external_services.custom_dashboards.discovery_auto_threshold
Threshold of the number of pods, for a given Application or Workload, above which dashboards discovery will be skipped. This setting only takes effect when discovery_enabled is set to ‘auto’.
.spec.external_services.custom_dashboards.discovery_enabled
Enable, disable or set ‘auto’ mode to the dashboards discovery process. If set to ‘true’, Kiali will always try to discover dashboards based on metrics. Note that this can generate performance penalties while discovering dashboards for workloads having many pods (thus many metrics). When set to ‘auto’, Kiali will skip dashboards discovery for workloads with more than a configured threshold of pods (see discovery_auto_threshold). When discovery is disabled or auto/skipped, it is still possible to tie workloads with dashboards through annotations on pods (refer to the doc https://kiali.io/docs/configuration/custom-dashboard/#pod-annotations). Value must be one of: true, false, auto.
.spec.external_services.custom_dashboards.enabled
Enable or disable custom dashboards, including the dashboards discovery process.
.spec.external_services.custom_dashboards.is_core
Used in the Components health feature. When true, the unhealthy scenarios will be raised as errors. Otherwise, they will be raised as a warning.
.spec.external_services.custom_dashboards.namespace_label
The Prometheus label name used for identifying namespaces in metrics for custom dashboards. The default is namespace but you may want to use kubernetes_namespace depending on your Prometheus configuration.
.spec.external_services.custom_dashboards.prometheus
The Prometheus configuration defined here refers to the Prometheus instance that is dedicated to fetching metrics for custom dashboards. This means you can obtain these metrics for the custom dashboards from a Prometheus instance that is different from the one that Istio uses. If this section is omitted, the same Prometheus that is used to obtain the Istio metrics will also be used for retrieving custom dashboard metrics.
.spec.external_services.custom_dashboards.prometheus.auth
Settings used to authenticate with the Prometheus instance.
.spec.external_services.custom_dashboards.prometheus.auth.ca_file
The certificate authority file to use when accessing Prometheus using https. An empty string means no extra certificate authority file is used.
.spec.external_services.custom_dashboards.prometheus.auth.insecure_skip_verify
Set true to skip verifying certificate validity when Kiali contacts Prometheus over https.
.spec.external_services.custom_dashboards.prometheus.auth.password
Password to be used when making requests to Prometheus, for basic authentication. May refer to a secret.
.spec.external_services.custom_dashboards.prometheus.auth.token
Token / API key to access Prometheus, for token-based authentication. May refer to a secret.
.spec.external_services.custom_dashboards.prometheus.auth.type
The type of authentication to use when contacting the server. Use bearer to send the token to the Prometheus server. Use basic to connect with username and password credentials. Use none to not use any authentication (this is the default).
.spec.external_services.custom_dashboards.prometheus.auth.use_kiali_token
When true and if auth.type is bearer, Kiali Service Account token will be used for the API calls to Prometheus (in this case, auth.token config is ignored).
.spec.external_services.custom_dashboards.prometheus.auth.username
Username to be used when making requests to Prometheus with basic authentication.
.spec.external_services.custom_dashboards.prometheus.cache_duration
Prometheus caching duration expressed in seconds.
.spec.external_services.custom_dashboards.prometheus.cache_enabled
Enable/disable Prometheus caching used for Health services.
.spec.external_services.custom_dashboards.prometheus.cache_expiration
Prometheus caching expiration expressed in seconds.
.spec.external_services.custom_dashboards.prometheus.custom_headers
A set of name/value settings that will be passed as headers when requests are sent to Prometheus.
.spec.external_services.custom_dashboards.prometheus.health_check_url
Used in the Components health feature. This is the url which Kiali will ping to determine whether the component is reachable or not. It defaults to url when not provided.
.spec.external_services.custom_dashboards.prometheus.is_core
Used in the Components health feature. When true, the unhealthy scenarios will be raised as errors. Otherwise, they will be raised as a warning.
.spec.external_services.custom_dashboards.prometheus.query_scope
A set of labelName/labelValue settings applied to every Prometheus query. Used to narrow unified metrics to only those scoped to the Kiali instance.
.spec.external_services.custom_dashboards.prometheus.thanos_proxy
Define this section if Prometheus is to be queried through a Thanos proxy. Kiali will still use the url setting to query for Prometheus metrics so make sure that is set appropriately.
.spec.external_services.custom_dashboards.prometheus.thanos_proxy.enabled
Set to true when a Thanos proxy is in front of Prometheus.
.spec.external_services.custom_dashboards.prometheus.thanos_proxy.retention_period
Thanos Retention period value expresed as a string.
.spec.external_services.custom_dashboards.prometheus.thanos_proxy.scrape_interval
Thanos Scrape interval value expresed as a string.
.spec.external_services.custom_dashboards.prometheus.url
The URL used to query the Prometheus Server. This URL must be accessible from the Kiali pod. If empty, the default will assume Prometheus is in the Istio control plane namespace; e.g. http://prometheus.<istio_namespace>:9090.
.spec.external_services.grafana
Configuration used to access the Grafana dashboards.
.spec.external_services.grafana.auth
Settings used to authenticate with the Grafana instance.
.spec.external_services.grafana.auth.ca_file
The certificate authority file to use when accessing Grafana using https. An empty string means no extra certificate authority file is used.
.spec.external_services.grafana.auth.insecure_skip_verify
Set true to skip verifying certificate validity when Kiali contacts Grafana over https.
.spec.external_services.grafana.auth.password
Password to be used when making requests to Grafana, for basic authentication. May refer to a secret.
.spec.external_services.grafana.auth.token
Token / API key to access Grafana, for token-based authentication. May refer to a secret.
.spec.external_services.grafana.auth.type
The type of authentication to use when contacting the server. Use bearer to send the token to the Grafana server. Use basic to connect with username and password credentials. Use none to not use any authentication (this is the default).
.spec.external_services.grafana.auth.use_kiali_token
When true and if auth.type is bearer, Kiali Service Account token will be used for the API calls to Grafana (in this case, auth.token config is ignored).
.spec.external_services.grafana.auth.username
Username to be used when making requests to Grafana with basic authentication.
.spec.external_services.grafana.dashboards
A list of Grafana dashboards that Kiali can link to.
.spec.external_services.grafana.dashboards[*]
.spec.external_services.grafana.dashboards[*].name
The name of the Grafana dashboard.
.spec.external_services.grafana.dashboards[*].variables
.spec.external_services.grafana.dashboards[*].variables.app
The name of a variable that holds the app name, if used in that dashboard (else it must be omitted).
.spec.external_services.grafana.dashboards[*].variables.namespace
The name of a variable that holds the namespace, if used in that dashboard (else it must be omitted).
.spec.external_services.grafana.dashboards[*].variables.service
The name of a variable that holds the service name, if used in that dashboard (else it must be omitted).
.spec.external_services.grafana.dashboards[*].variables.workload
The name of a variable that holds the workload name, if used in that dashboard (else it must be omitted).
.spec.external_services.grafana.enabled
When true, Grafana support will be enabled in Kiali.
.spec.external_services.grafana.health_check_url
Used in the Components health feature. This is the URL which Kiali will ping to determine whether the component is reachable or not. It defaults to in_cluster_url when not provided.
.spec.external_services.grafana.in_cluster_url
The URL used for in-cluster access. An example would be http://grafana.istio-system:3000. This URL can contain query parameters if needed, such as ‘?orgId=1’. If not defined, it will default to http://grafana.<istio_namespace>:3000.
.spec.external_services.grafana.is_core
Used in the Components health feature. When true, the unhealthy scenarios will be raised as errors. Otherwise, they will be raised as a warning.
.spec.external_services.grafana.url
The URL that Kiali uses when integrating with Grafana. This URL must be accessible to clients external to the cluster in order for the integration to work properly. If empty, an attempt to auto-discover it is made. This URL can contain query parameters if needed, such as ‘?orgId=1’.
.spec.external_services.istio
Istio configuration that Kiali needs to know about in order to observe the mesh.
.spec.external_services.istio.component_status
Istio components whose status will be monitored by Kiali.
.spec.external_services.istio.component_status.components
A specific Istio component whose status will be monitored by Kiali.
.spec.external_services.istio.component_status.components[*]
.spec.external_services.istio.component_status.components[*].app_label
Istio component pod app label.
.spec.external_services.istio.component_status.components[*].is_core
Whether the component is to be considered a core component for your deployment.
.spec.external_services.istio.component_status.components[*].is_proxy
Whether the component is a native Envoy proxy.
.spec.external_services.istio.component_status.components[*].namespace
The namespace where the component is installed. It defaults to the Istio control plane namespace (e.g. istio_namespace) setting. Note that the Istio documentation suggests you install the ingress and egress to different namespaces, so you most likely will want to explicitly set this namespace value for the ingress and egress components.
.spec.external_services.istio.component_status.enabled
Determines if Istio component statuses will be displayed in the Kiali masthead indicator.
.spec.external_services.istio.config_map_name
The name of the istio control plane config map.
.spec.external_services.istio.envoy_admin_local_port
The port which kiali will open to fetch envoy config data information.
.spec.external_services.istio.istio_canary_revision
These values are used in Canary upgrade/downgrade functionality when istio_upgrade_action is true.
.spec.external_services.istio.istio_canary_revision.current
The currently installed Istio revision.
.spec.external_services.istio.istio_canary_revision.upgrade
The installed Istio canary revision to upgrade to.
.spec.external_services.istio.istio_identity_domain
The annotation used by Istio to identify domains.
.spec.external_services.istio.istio_injection_annotation
The name of the field that annotates a workload to indicate a sidecar should be automatically injected by Istio. This is the name of a Kubernetes annotation. Note that some Istio implementations also support labels by the same name. In other words, if a workload has a Kubernetes label with this name, that may also trigger automatic sidecar injection.
.spec.external_services.istio.istio_sidecar_annotation
The pod annotation used by Istio to identify the sidecar.
.spec.external_services.istio.istio_sidecar_injector_config_map_name
The name of the istio-sidecar-injector config map.
.spec.external_services.istio.istiod_deployment_name
The name of the istiod deployment.
.spec.external_services.istio.istiod_pod_monitoring_port
The monitoring port of the IstioD pod (not the Service).
.spec.external_services.istio.root_namespace
The namespace to treat as the administrative root namespace for Istio configuration.
.spec.external_services.istio.url_service_version
The Istio service used to determine the Istio version. If empty, assumes the URL for the well-known Istio version endpoint.
.spec.external_services.prometheus
The Prometheus configuration defined here refers to the Prometheus instance that is used by Istio to store its telemetry.
.spec.external_services.prometheus.auth
Settings used to authenticate with the Prometheus instance.
.spec.external_services.prometheus.auth.ca_file
The certificate authority file to use when accessing Prometheus using https. An empty string means no extra certificate authority file is used.
.spec.external_services.prometheus.auth.insecure_skip_verify
Set true to skip verifying certificate validity when Kiali contacts Prometheus over https.
.spec.external_services.prometheus.auth.password
Password to be used when making requests to Prometheus, for basic authentication. May refer to a secret.
.spec.external_services.prometheus.auth.token
Token / API key to access Prometheus, for token-based authentication. May refer to a secret.
.spec.external_services.prometheus.auth.type
The type of authentication to use when contacting the server. Use bearer to send the token to the Prometheus server. Use basic to connect with username and password credentials. Use none to not use any authentication (this is the default).
.spec.external_services.prometheus.auth.use_kiali_token
When true and if auth.type is bearer, Kiali Service Account token will be used for the API calls to Prometheus (in this case, auth.token config is ignored).
.spec.external_services.prometheus.auth.username
Username to be used when making requests to Prometheus with basic authentication.
.spec.external_services.prometheus.cache_duration
Prometheus caching duration expressed in seconds.
.spec.external_services.prometheus.cache_enabled
Enable/disable Prometheus caching used for Health services.
.spec.external_services.prometheus.cache_expiration
Prometheus caching expiration expressed in seconds.
.spec.external_services.prometheus.custom_headers
A set of name/value settings that will be passed as headers when requests are sent to Prometheus.
.spec.external_services.prometheus.health_check_url
Used in the Components health feature. This is the url which Kiali will ping to determine whether the component is reachable or not. It defaults to url when not provided.
.spec.external_services.prometheus.is_core
Used in the Components health feature. When true, the unhealthy scenarios will be raised as errors. Otherwise, they will be raised as a warning.
.spec.external_services.prometheus.query_scope
A set of labelName/labelValue settings applied to every Prometheus query. Used to narrow unified metrics to only those scoped to the Kiali instance.
.spec.external_services.prometheus.thanos_proxy
Define this section if Prometheus is to be queried through a Thanos proxy. Kiali will still use the url setting to query for Prometheus metrics so make sure that is set appropriately.
.spec.external_services.prometheus.thanos_proxy.enabled
Set to true when a Thanos proxy is in front of Prometheus.
.spec.external_services.prometheus.thanos_proxy.retention_period
Thanos Retention period value expresed as a string.
.spec.external_services.prometheus.thanos_proxy.scrape_interval
Thanos Scrape interval value expresed as a string.
.spec.external_services.prometheus.url
The URL used to query the Prometheus Server. This URL must be accessible from the Kiali pod. If empty, the default will assume Prometheus is in the Istio control plane namespace; e.g. http://prometheus.<istio_namespace>:9090.
.spec.external_services.tracing
Configuration used to access the Tracing (Jaeger) dashboards.
.spec.external_services.tracing.auth
Settings used to authenticate with the Tracing server instance.
.spec.external_services.tracing.auth.ca_file
The certificate authority file to use when accessing the Tracing server using https. An empty string means no extra certificate authority file is used.
.spec.external_services.tracing.auth.insecure_skip_verify
Set true to skip verifying certificate validity when Kiali contacts the Tracing server over https.
.spec.external_services.tracing.auth.password
Password to be used when making requests to the Tracing server, for basic authentication. May refer to a secret.
.spec.external_services.tracing.auth.token
Token / API key to access the Tracing server, for token-based authentication. May refer to a secret.
.spec.external_services.tracing.auth.type
The type of authentication to use when contacting the server. Use bearer to send the token to the Tracing server. Use basic to connect with username and password credentials. Use none to not use any authentication (this is the default).
.spec.external_services.tracing.auth.use_kiali_token
When true and if auth.type is bearer, Kiali Service Account token will be used for the API calls to the Tracing server (in this case, auth.token config is ignored).
.spec.external_services.tracing.auth.username
Username to be used when making requests to the Tracing server with basic authentication.
.spec.external_services.tracing.enabled
When true, connections to the Tracing server are enabled. in_cluster_url and/or url need to be provided.
.spec.external_services.tracing.in_cluster_url
Set URL for in-cluster access, which enables further integration between Kiali and Jaeger. When not provided, Kiali will only show external links using the url setting. Note: Jaeger v1.20+ has separated ports for GRPC(16685) and HTTP(16686) requests. Make sure you use the appropriate port according to the use_grpc value. Example: http://tracing.istio-system:16685
.spec.external_services.tracing.is_core
Used in the Components health feature. When true, the unhealthy scenarios will be raised as errors. Otherwise, they will be raised as a warning.
.spec.external_services.tracing.namespace_selector
Kiali use this boolean to find traces with a namespace selector : service.namespace.
.spec.external_services.tracing.query_scope
A set of tagKey/tagValue settings applied to every Jaeger query. Used to narrow unified traces to only those scoped to the Kiali instance.
.spec.external_services.tracing.url
The external URL that will be used to generate links to Jaeger. It must be accessible to clients external to the cluster (e.g: a browser) in order to generate valid links. If the tracing service is deployed with a QUERY_BASE_PATH set, set this URL like https://
.spec.external_services.tracing.use_grpc
Set to true in order to enable GRPC connections between Kiali and Jaeger which will speed up the queries. In some setups you might not be able to use GRPC (e.g. if Jaeger is behind some reverse proxy that doesn’t support it). If not specified, this will defalt to ‘false’ if deployed within a Maistra/OSSM+OpenShift environment, ‘true’ otherwise.
.spec.external_services.tracing.whitelist_istio_system
Kiali will get the traces of these services found in the Istio control plane namespace.
.spec.external_services.tracing.whitelist_istio_system[*]
A name of a service found in the Istio control plane namespace whose traces will be retrieved by Kiali.
.spec.health_config
This section defines what it means for nodes to be healthy. For more details, see https://kiali.io/docs/configuration/health/
.spec.health_config.rate
.spec.health_config.rate[*]
.spec.health_config.rate[*].kind
The type of resource that this configuration applies to. This is a regular expression.
.spec.health_config.rate[*].name
The name of a resource that this configuration applies to. This is a regular expression.
.spec.health_config.rate[*].namespace
The name of the namespace that this configuration applies to. This is a regular expression.
.spec.health_config.rate[*].tolerance
A list of tolerances for this configuration.
.spec.health_config.rate[*].tolerance[*]
.spec.health_config.rate[*].tolerance[*].code
The status code that applies for this tolerance. This is a regular expression.
.spec.health_config.rate[*].tolerance[*].degraded
Health will be considered degraded when the telemetry reaches this value (specified as an integer representing a percentage).
.spec.health_config.rate[*].tolerance[*].direction
The direction that applies for this tolerance (e.g. inbound or outbound). This is a regular expression.
.spec.health_config.rate[*].tolerance[*].failure
A failure status will be shown when the telemetry reaches this value (specified as an integer representing a percentage).
.spec.health_config.rate[*].tolerance[*].protocol
The protocol that applies for this tolerance (e.g. grpc or http). This is a regular expression.
.spec.identity
Settings that define the Kiali server identity.
.spec.identity.cert_file
Certificate file used to identify the Kiali server. If set, you must go over https to access Kiali. The Kiali operator will set this if it deploys Kiali behind https. When left undefined, the operator will attempt to generate a cluster-specific cert file that provides https by default (today, this auto-generation of a cluster-specific cert is only supported on OpenShift). When set to an empty string, https will be disabled.
.spec.identity.private_key_file
Private key file used to identify the Kiali server. If set, you must go over https to access Kiali. When left undefined, the Kiali operator will attempt to generate a cluster-specific private key file that provides https by default (today, this auto-generation of a cluster-specific private key is only supported on OpenShift). When set to an empty string, https will be disabled.
.spec.installation_tag
Tag used to identify a particular instance/installation of the Kiali server. This is merely a human-readable string that will be used within Kiali to help a user identify the Kiali being used (e.g. in the Kiali UI title bar). See deployment.instance_name for the setting used to customize Kiali resource names that are created.
.spec.istio_labels
Defines specific labels used by Istio that Kiali needs to know about.
.spec.istio_labels.app_label_name
The name of the label used to define what application a workload belongs to. This is typically something like app or app.kubernetes.io/name.
.spec.istio_labels.injection_label_name
The name of the label used to instruct Istio to automatically inject sidecar proxies when applications are deployed.
.spec.istio_labels.injection_label_rev
The label used to identify the Istio revision.
.spec.istio_labels.version_label_name
The name of the label used to define what version of the application a workload belongs to. This is typically something like version or app.kubernetes.io/version.
.spec.istio_namespace
The namespace where Istio is installed. If left empty, it is assumed to be the same namespace as where Kiali is installed (i.e. deployment.namespace).
.spec.kiali_feature_flags
Kiali features that can be enabled or disabled.
.spec.kiali_feature_flags.certificates_information_indicators
Flag to enable/disable displaying certificates information and which secrets to grant read permissions.
.spec.kiali_feature_flags.certificates_information_indicators.enabled
.spec.kiali_feature_flags.certificates_information_indicators.secrets
.spec.kiali_feature_flags.certificates_information_indicators.secrets[*]
.spec.kiali_feature_flags.clustering
Clustering and federation related features.
.spec.kiali_feature_flags.clustering.enabled
Flag to enable/disable clustering and federation related features.
.spec.kiali_feature_flags.disabled_features
There may be some features that admins do not want to be accessible to users (even in ‘view only’ mode). In this case, this setting allows you to disable one or more of those features entirely.
.spec.kiali_feature_flags.disabled_features[*]
.spec.kiali_feature_flags.istio_injection_action
Flag to enable/disable an Action to label a namespace for automatic Istio Sidecar injection.
.spec.kiali_feature_flags.istio_upgrade_action
Flag to activate the Kiali functionality of upgrading namespaces to point to an installed Istio Canary revision. Related Canary upgrade and current revisions of Istio should be defined in istio_canary_revision section.
.spec.kiali_feature_flags.ui_defaults
Default settings for the UI. These defaults apply to all users.
.spec.kiali_feature_flags.ui_defaults.graph
Default settings for the Graph UI.
.spec.kiali_feature_flags.ui_defaults.graph.find_options
A list of commonly used and useful find expressions that will be provided to the user out-of-box.
.spec.kiali_feature_flags.ui_defaults.graph.find_options[*]
.spec.kiali_feature_flags.ui_defaults.graph.find_options[*].description
Human-readable text to let the user know what the expression does.
.spec.kiali_feature_flags.ui_defaults.graph.find_options[*].expression
The find expression.
.spec.kiali_feature_flags.ui_defaults.graph.hide_options
A list of commonly used and useful hide expressions that will be provided to the user out-of-box.
.spec.kiali_feature_flags.ui_defaults.graph.hide_options[*]
.spec.kiali_feature_flags.ui_defaults.graph.hide_options[*].description
Human-readable text to let the user know what the expression does.
.spec.kiali_feature_flags.ui_defaults.graph.hide_options[*].expression
The hide expression.
.spec.kiali_feature_flags.ui_defaults.graph.traffic
These settings determine which rates are used to determine graph traffic.
.spec.kiali_feature_flags.ui_defaults.graph.traffic.grpc
gRPC traffic is measured in requests or sent/received/total messages. Value must be one of: none, requests, sent, received, or total.
.spec.kiali_feature_flags.ui_defaults.graph.traffic.http
HTTP traffic is measured in requests. Value must be one of: none or requests.
.spec.kiali_feature_flags.ui_defaults.graph.traffic.tcp
TCP traffic is measured in sent/received/total bytes. Only request traffic supplies response codes. Value must be one of: none, sent, received, or total.
.spec.kiali_feature_flags.ui_defaults.metrics_inbound
Additional label aggregation for inbound metric pages in detail pages. You will see these configurations in the ‘Metric Settings’ drop-down. An example,
metrics_inbound:
  aggregations:
  - display_name: Istio Network
    label: topology_istio_io_network
  - display_name: Istio Revision
    label: istio_io_rev
.spec.kiali_feature_flags.ui_defaults.metrics_inbound.aggregations
.spec.kiali_feature_flags.ui_defaults.metrics_inbound.aggregations[*]
.spec.kiali_feature_flags.ui_defaults.metrics_inbound.aggregations[*].display_name
.spec.kiali_feature_flags.ui_defaults.metrics_inbound.aggregations[*].label
.spec.kiali_feature_flags.ui_defaults.metrics_outbound
Additional label aggregation for outbound metric pages in detail pages. You will see these configurations in the ‘Metric Settings’ drop-down. An example,
metrics_outbound:
  aggregations:
  - display_name: Istio Network
    label: topology_istio_io_network
  - display_name: Istio Revision
    label: istio_io_rev
.spec.kiali_feature_flags.ui_defaults.metrics_outbound.aggregations
.spec.kiali_feature_flags.ui_defaults.metrics_outbound.aggregations[*]
.spec.kiali_feature_flags.ui_defaults.metrics_outbound.aggregations[*].display_name
.spec.kiali_feature_flags.ui_defaults.metrics_outbound.aggregations[*].label
.spec.kiali_feature_flags.ui_defaults.metrics_per_refresh
Duration of metrics to fetch on each refresh. Value must be one of: 1m, 2m, 5m, 10m, 30m, 1h, 3h, 6h, 12h, 1d, 7d, or 30d
.spec.kiali_feature_flags.ui_defaults.namespaces
Default selections for the namespace selection dropdown. Non-existent or inaccessible namespaces will be ignored. Omit or set to an empty array for no default namespaces.
.spec.kiali_feature_flags.ui_defaults.namespaces[*]
.spec.kiali_feature_flags.ui_defaults.refresh_interval
The automatic refresh interval for pages offering automatic refresh. Value must be one of: pause, 10s, 15s, 30s, 1m, 5m or 15m
.spec.kiali_feature_flags.validations
Features specific to the validations subsystem.
.spec.kiali_feature_flags.validations.ignore
A list of one or more validation codes whose errors are to be ignored.
.spec.kiali_feature_flags.validations.ignore[*]
A validation code (e.g. KIA0101) for a specific validation error that is to be ignored.
.spec.kubernetes_config
Configuration of Kiali’s access of the Kubernetes API.
.spec.kubernetes_config.burst
The Burst value of the Kubernetes client.
.spec.kubernetes_config.cache_duration
The ratio interval (expressed in seconds) used for the cache to perform a full refresh. Only used when cache_enabled is true.
.spec.kubernetes_config.cache_enabled
Flag to use a Kubernetes cache for watching changes and updating pods and controllers data asynchronously.
.spec.kubernetes_config.cache_istio_types
Kiali can cache VirtualService, DestinationRule, Gateway and ServiceEntry Istio resources if they are present on this list of Istio types. Other Istio types are not yet supported.
.spec.kubernetes_config.cache_istio_types[*]
.spec.kubernetes_config.cache_namespaces
List of namespaces or regex defining namespaces to include in a cache.
.spec.kubernetes_config.cache_namespaces[*]
.spec.kubernetes_config.cache_token_namespace_duration
This Kiali cache is a list of namespaces per user. This is typically a short-lived cache compared with the duration of the namespace cache defined by the cache_duration setting. This is specified in seconds.
.spec.kubernetes_config.excluded_workloads
List of controllers that won’t be used for Workload calculation. Kiali queries Deployment, ReplicaSet, ReplicationController, DeploymentConfig, StatefulSet, Job and CronJob controllers. Deployment and ReplicaSet will be always queried, but ReplicationController, DeploymentConfig, StatefulSet, Job and CronJobs can be skipped from Kiali workloads queries if they are present in this list.
.spec.kubernetes_config.excluded_workloads[*]
.spec.kubernetes_config.qps
The QPS value of the Kubernetes client.
.spec.login_token
.spec.login_token.expiration_seconds
A user’s login token expiration specified in seconds. This is applicable to token and header auth strategies only.
.spec.login_token.signing_key
The signing key used to generate tokens for user authentication. Because this is potentially sensitive, you have the option to store this value in a secret. If you store this signing key value in a secret, you must indicate what key in what secret by setting this value to a string in the form of secret:<secretName>:<secretKey>. If left as an empty string, a secret with a random signing key will be generated for you. The signing key must be 16, 24 or 32 byte long.
.spec.server
Configuration that controls some core components within the Kiali Server.
.spec.server.address
Where the Kiali server is bound. The console and API server are accessible on this host.
.spec.server.audit_log
When true, allows additional audit logging on write operations.
.spec.server.cors_allow_all
When true, allows the web console to send requests to other domains other than where the console came from. Typically used for development environments only.
.spec.server.gzip_enabled
When true, Kiali serves http requests with gzip enabled (if the browser supports it) when the requests are over 1400 bytes.
.spec.server.observability
Settings to enable observability into the Kiali server itself.
.spec.server.observability.metrics
Settings that control how Kiali itself emits its own metrics.
.spec.server.observability.metrics.enabled
When true, the metrics endpoint will be available for Prometheus to scrape.
.spec.server.observability.metrics.port
The port that the server will bind to in order to receive metric requests. This is the port Prometheus will need to scrape when collecting metrics from Kiali.
.spec.server.observability.tracing
Settings that control how the Kiali server itself emits its own tracing data.
.spec.server.observability.tracing.collector_url
The URL used to determine where the Kiali server tracing data will be stored.
.spec.server.observability.tracing.enabled
When true, the Kiali server itself will product its own tracing data.
.spec.server.port
The port that the server will bind to in order to receive console and API requests.
.spec.server.web_fqdn
Defines the public domain where Kiali is being served. This is the ‘domain’ part of the URL (usually it’s a fully-qualified domain name). For example, kiali.example.org. When empty, Kiali will try to guess this value from HTTP headers. On non-OpenShift clusters, you must populate this value if you want to enable cross-linking between Kiali instances in a multi-cluster setup.
.spec.server.web_history_mode
Define the history mode of kiali UI. Value must be one of: browser or hash.
.spec.server.web_port
Defines the ingress port where the connections come from. This is usually necessary when the application responds through a proxy/ingress, and it does not forward the correct headers (when this happens, Kiali cannot guess the port). When empty, Kiali will try to guess this value from HTTP headers.
.spec.server.web_root
Defines the context root path for the Kiali console and API endpoints and readiness probes. When providing a context root path that is not /, do not add a trailing slash (i.e. use /kiali not /kiali/). When empty, this will default to / on OpenShift and /kiali on other Kubernetes environments.
.spec.server.web_schema
Defines the public HTTP schema used to serve Kiali. Value must be one of: http or https. When empty, Kiali will try to guess this value from HTTP headers. On non-OpenShift clusters, you must populate this value if you want to enable cross-linking between Kiali instances in a multi-cluster setup.
.spec.version
The version of the Ansible playbook to execute in order to install that version of Kiali.
It is rare you will want to set this - if you are thinking of setting this, know what you are doing first.
The only supported value today is default.
If not specified, a default version of Kiali will be installed which will be the most recent release of Kiali. Refer to this file to see where these values are defined in the master branch, https://github.com/kiali/kiali-operator/tree/master/playbooks/default-supported-images.yml
This version setting affects the defaults of the deployment.image_name and deployment.image_version settings. See the comments for those settings below for additional details. But in short, this version setting will dictate which version of the Kiali image will be deployed by default. Note that if you explicitly set deployment.image_name and/or deployment.image_version you are responsible for ensuring those settings are compatible with this setting (i.e. the Kiali image must be compatible with the rest of the configuration and resources the operator will install).
.status
The processing status of this CR as reported by the Kiali operator.
2.6 - Namespace Management
Introduction
The default Kiali installation (as mentioned in the Installation guide) gives Kiali access to all namespaces available in the cluster.
It is possible to restrict Kiali to a set of desired namespaces by providing a list of the ones you want, excluding the ones you don’t want, or filtering by a label selector. You can use a combination of these options.
Accessible Namespaces
You can configure which namespaces are accessible and observable through Kiali. You can use regex expressions which will be matched against the operator’s visible namespaces. If not set in the Kiali CR, the default makes accessible all cluster namespaces, with the exception of a predefined set of the cluster’s system workloads.
The list of accessible namespaces is specified in the Kiali CR via the
accessible_namespaces setting, under the main deployment section. As an
example, if Kiali is to be installed in the istio-system namespace, and is
expected to monitor all namespaces prefixed with mycorp_, the setting would
be:
spec:
  deployment:
    accessible_namespaces:
    - istio-system
    - mycorp_.*
Note that the namespaces declared here (including any regex expressions) are evaluated and discovered at install time. Namespaces that do not exist at the time of install but are created later in the future will not be accessible by Kiali. For Kiali to be given access to namespaces created in the future, you must edit the Kiali CR and update the accessible_namespaces setting to include the new namespaces. The one exception is if you set accessible_namespaces to the special value ["**"] - in that case, all namespaces (including any namespaces created in the future) will be accessible to Kiali.
This configuration accepts the special pattern accessible_namespaces: ["**"]
which denotes that Kiali is given access to all namespaces in the cluster, including any namespaces created in the future.
accessible_namespaces: ["**"],
you must specify the --set clusterRoleCreator=true flag when invoking helm install.
When installing multiple Kiali instances into a single cluster,
accessible_namespaces must be mutually exclusive. In other words, a namespace
set must be matched by only one Kiali CR. Regular expressions must not have
overlapping patterns.
accessible_namespaces: ["**"].
Maistra supports multi-tenancy and the accessible_namespaces extends that
feature to Kiali. However, explicit naming of accessible namespaces can benefit
non-Maistra installations as well - with it Kiali does not need cluster roles
and the Kiali Operator does not need permissions to create cluster roles.
Excluded Namespaces
The Kiali CR tells the Kiali Operator which accessible namespaces should be excluded from the list of namespaces provided by the API and UI. This can be useful if wildcards are used when specifying Accessible Namespaces. This setting has no effect on namespace accessibility. It is only a filter, not security-related.
For example, if the accessible_namespaces configuration includes mycorp_.* but it is not desirable to see test namespaces, the following configuration can be used:
api:
  namespaces:
    exclude:
      - mycorp_test.*
Namespace Selectors
To fetch a subset of the available namespaces, Kiali supports an optional Kubernetes label selector. This selector is especially useful when spec.deployment.accessible_namespaces is set to ["**"] but you want to reduce the namespaces presented in the UI’s namespace list.
The label selector is defined in the Kiali CR setting spec.api.namespaces.label_selector.
The example below selects all namespaces that have a label kiali-enabled: true:
api:
  namespaces:
    label_selector: kiali-enabled=true
For further information on how this api.namespaces.label_selector interacts with spec.deployment.accessible_namespaces read the Kiali CR Reference documentation.
To label a namespace you can use the following command. For more information see the Kubernete’s official documentation.
kubectl label namespace my-namespace kiali-enabled=true
Note that when deploying multiple control planes in the same cluster, you will want to set the label selector’s value unique to each control plane. This allows each Kiali instance to select only the namespaces relevant to each control plane. Because in this “soft-multitenancy” mode spec.deployment.accessible_namespaces is typically set to an explicit set of namespaces (i.e. not ["**"]), you do not have to do anything with this label_selector. This is because the default value of label_selector is kiali.io/member-of: <spec.istio_namespace> when spec.deployment.accessible_namespaces is not set to the “all namespaces” value ["**"]. This allows you to have multiple control planes in the same cluster, with each control plane having its own Kiali instance. If you set your own Kiali instance name in the Kiali CR (i.e. you set spec.deployment.instance_name to something other than kiali), then the default label will be kiali.io/<spec.deployment.instance_name>.member-of: <spec.istio_namespace>.
2.7 - Prometheus, Jaeger, Grafana
Prometheus is a required telemetry data source for Kiali. Jaeger is a highly recommended tracing data source. Kiali also offers a simple Grafana add-on integration. This page describes how to configure Kiali to communicate with these dependencies.
Read the dedicated configuration page to learn more.
2.7.1 - Grafana
Grafana configuration
Istio provides preconfigured Grafana dashboards for the most relevant metrics of the mesh. Although Kiali offers similar views in its metrics dashboards, it is not in Kiali’s goals to provide the advanced querying options, nor the highly customizable settings, that are available in Grafana. Thus, it is recommended that you use Grafana if you need those advanced options.
Kiali can provide a direct link from its metric dashboards to the equivalent or most similar Grafana dashboard, which is convenient if you need the powerful Grafana options. For these links to appear in Kiali you need to manually configure the Grafana URL, like in the following example:
spec:
  external_services:
    grafana:
      enabled: true
      # Grafana service name is "grafana" and is in the "telemetry" namespace.
      in_cluster_url: 'http://grafana.telemetry:3000/'
      # Public facing URL of Grafana
      url: 'http://my-ingress-host/grafana'
2.7.2 - Jaeger
Jaeger configuration
Jaeger is a highly recommended service because Kiali uses distributed tracing data for several features, providing an enhanced experience.
By default, Kiali will try to reach Jaeger at the GRPC-enabled URL of the form
http://tracing.<istio_namespace_name>:16685/jaeger, which is the usual case
if you are using the Jaeger Istio
add-on.
If this endpoint is unreachable, Kiali will disable features that use
distributed tracing data.
If your Jaeger instance has a different service name or is installed to a different namespace, you must manually provide the endpoint where it is available, like in the following example:
spec:
  external_services:
    tracing:
      # Enabled by default. Kiali will anyway fallback to disabled if
      # Jaeger is unreachable.
      enabled: true
      # Jaeger service name is "tracing" and is in the "telemetry" namespace.
      # Make sure the URL you provide corresponds to the non-GRPC enabled endpoint
      # if you set "use_grpc" to false.
      in_cluster_url: 'http://tracing.telemetry:16685/jaeger'
      use_grpc: true
      # Public facing URL of Jaeger
      url: 'http://my-jaeger-host/jaeger'
Minimally, you must provide spec.external_services.tracing.in_cluster_url to
enable Kiali features that use distributed tracing data. However, Kiali can
provide contextual links that users can use to jump to the Jaeger console to
inspect tracing data more in depth. For these links to be available you need to
set the spec.external_services.tracing.url which may mean that you should
expose Jaeger outside the cluster.
2.7.3 - Prometheus
Prometheus configuration
Kiali requires Prometheus to generate the topology graph, show metrics, calculate health and for several other features. If Prometheus is missing or Kiali can’t reach it, Kiali won’t work properly.
By default, Kiali assumes that Prometheus is available at the URL of the form
http://prometheus.<istio_namespace_name>:9090, which is the usual case if you
are using the Prometheus Istio
add-on.
If your Prometheus instance has a different service name or is installed in a
different namespace, you must manually provide the endpoint where it is
available, like in the following example:
spec:
  external_services:
    prometheus:
      # Prometheus service name is "metrics" and is in the "telemetry" namespace
      url: "http://metrics.telemetry:9090/"
Kiali maintains an internal cache of some Prometheus queries to improve performance (mainly, the queries to calculate Health indicators). It would be very rare to see data delays, but should you notice any delays you may tune caching parameters to values that work better for your environment.
See the [Kiali CR reference page]("/docs/configuration/kialis.kiali.io/#example-cr" >}}) for the current default values.
Compatibility with Prometheus-like servers
Although Kiali assumes a Prometheus server and is tested against it, there are TSDBs that can be used as a Prometheus replacement despite not implementing the full Prometheus API.
Community users have faced two issues when using Prometheus-like TSDBs:
- Kiali may report that the TSDB is unreachable, and/or
- Kiali may show empty metrics if the TSBD does not implement the
/api/v1/status/config.
To fix these issues, you may need to provide a custom health check endpoint for
the TSDB and/or manually provide the configurations that Kiali reads from the
/api/v1/status/config API endpoint:
spec:
  external_services:
    prometheus:
      # Fix the "Unreachable" metrics server warning.
      health_check_url: "http://custom-tsdb-health-check-url"
      # Fix for the empty metrics dashboards
      thanos_proxy:
        enabled: true
        retention_period: "7d"
        scrape_interval: "30s"
Prometheus Tuning
Production environments should not be using the Istio Prometheus add-on, or carrying over its configuration settings. That is useful only for small, or demo installations. Instead, Prometheus should have been installed in a production-oriented way, following the Prometheus documentation.
This section is primarily for users where Prometheus is being used specifically for Kiali, and possible optimizations that can be made knowing that Kiali does not utilize all of the default Istio and Envoy telemetry.
Metric Thinning
Istio and Envoy generate a large amount of telemetry for analysis and troubleshooting. This can result in significant resources being required to ingest and store the telemetry, and to support queries into the data. If you use the telemetry specifically to support Kiali, it is possible to drop unnecessary metrics and unnecessary labels on required metrics. This FAQ Entry displays the metrics and attributes required for Kiali to operate.
To reduce the default telemetry to only what is needed by Kiali1 users can add the following snippet to their Prometheus configuration. Because things can change with different versions, it is recommended to ensure you use the correct version of this documentation based on your Kiali/Istio version.
The metric_relabel_configs: attribute should be added under each job name defined to scrape Istio or Envoy metrics. Below we show it under the kubernetes-pods job, but you should adapt as needed. Be careful of indentation.
    - job_name: kubernetes-pods
      metric_relabel_configs:
      - action: drop
        source_labels: [__name__]
        regex: istio_agent_.*|istiod_.*|istio_build|citadel_.*|galley_.*|pilot_.*|envoy_cluster_[^u].*|envoy_cluster_update.*|envoy_listener_[^dh].*|envoy_server_[^mu].*|envoy_wasm_.*
      - action: labeldrop
        regex: chart|destination_app|destination_version|heritage|.*operator.*|istio.*|release|security_istio_io_.*|service_istio_io_.*|sidecar_istio_io_inject|source_app|source_version
Applying this configuration should reduce the number of stored metrics by about 20%, as well as reducing the number of attributes stored on many remaining metrics.
Metric Thinning with Crippling
The section above drops metrics unused by Kiali. As such, making those configuration changes should not negatively impact Kiali behavior in any way. But some very heavy metrics remain. These metrics can also be dropped, but their removal will impact the behavior of Kiali. This may be OK if you don’t use the affected features of Kiali, or if you are willing to sacrifice the feature for the associated metric savings. In particular, these are “Histogram” metrics. Istio is planning to make some improvements to help users better configure these metrics, but as of this writing they are still defined with fairly inefficient default “buckets”, making the number of associated time-series quite large, and the overhead of maintaining and querying the metrics, intensive. Each histogram actually is comprised of 3 stored metrics. For example, a histogram named xxx would result in the following metrics stored into Prometheus:
xxx_bucket- The most intensive metric, and is required to calculate percentile values.
xxx_count- Required to calculate ‘avg’ values.
xxx_sum- Required to calculate rates over time, and for ‘avg’ values.
When considering whether to thin the Histogram metrics, one of the following three approaches is recommended:
- If the relevant Kiali reporting is needed, keep the histogram as-is.
- If the relevant Kiali reporting is not needed, or not worth the additional metric overhead, drop the entire histogram.
- If the metric chart percentiles are not required, drop only the xxx_bucket metric. This removes the majority of the histogram overhead while keeping rate and average (non-percentile) values in Kiali.
These are the relevant Histogram metrics:
istio_request_bytes
This metric is used to produce the Request Size chart on the metric tabs. It also supports Request Throughput edge labels on the graph.
- Appending
|istio_request_bytes_.*to thedropregex above would drop all associated metrics and would prevent any request size/throughput reporting in Kiali. - Appending
|istio_request_bytes_bucketto thedropregex above, would prevent any request size percentile reporting in the Kiali metric charts.
istio_response_bytes
This metric is used to produce the Response Size chart on the metric tabs. And also supports Response Throughput edge labels on the graph
- Appending
|istio_response_bytes_.*to thedropregex above would drop all associated metrics and would prevent any response size/throughput reporting in Kiali. - Appending
|istio_response_bytes_bucketto thedropregex above would prevent any response size percentile reporting in the Kiali metric charts.
istio_request_duration_milliseconds
This metric is used to produce the Request Duration chart on the metric tabs. It also supports Response Time edge labels on the graph.
- Appending
|istio_request_duration_milliseconds_.*to thedropregex above would drop all associated metrics and would prevent any request duration/response time reporting in Kiali. - Appending
|istio_request_duration_milliseconds_bucketto thedropregex above would prevent any request duration/response time percentile reporting in the Kiali metric charts or graph edge labels.
Scrape Interval
The Prometheus globalScrapeInterval is an important configuration option2. The scrape interval can have a significant effect on metrics collection overhead as it takes effort to pull all of those configured metrics and update the relevant time-series. And although it doesn’t affect time-series cardinality, it does affect storage for the data-points, as well as having impact when computing query results (the more data-points, the more processing and aggregation).
Users should think carefully about their configured scrape interval. Note that the Istio addon for prometheus configures it to 15s. This is great for demos but may be too frequent for production scenarios. The prometheus helm charts set a default of 1m, which is more reasonable for most installations, but may not be the desired frequency for any particular setup.
The recommendation for Kiali is to set the longest interval possible, while still providing a useful granularity. The longer the interval the less data points scraped, thus reducing processing, storage, and computational overhead. But the impact on Kiali should be understood. It is important to realize that request rates (or byte rates, message rates, etc) require a minumum of two data points:
rate = (dp2 - dp1) / timePeriod
That means for Kiali to show anything useful in the graph, or anywhere rates are used (many places), the minimum duration must be >= 2 x globalScrapeInterval. Kiali will eliminate invalid Duration options given the globalScrapeInterval.
Kiali does a lot of aggregation and querying over time periods. As such, the number of data points will affect query performance, especially for larger time periods.
For more information, see the Prometheus documentation.
TSDB retention time
The Prometheus tsdbRetentionTime is an important configuration option. It has a significant effect on metrics storage, as Prometheus will keep each reported data-point for that period of time, performing compaction as needed. The larger the retention time, the larger the required storage. Note also that Kiali queries against large time periods, and very large data-sets, may result in poor performance or timeouts.
The recommendation for Kiali is to set the shortest retention time that meets your needs and/or operational limits. In some cases users may want to offload older data to a secondary store. Kiali will eliminate invalid Duration options given the tsdbRetentionTime.
For more information, see the Prometheus documentation.
-
Some non-essential telemetry remains in order to not over-complicate the configuration change. The remaining telemetry is typically negligible. ↩︎
-
Note that Prometheus can be configured such that individual scrape points can override the global setting, but Kiali is not currently concerned with this corner case. ↩︎
2.8 - Role-based access control
Introduction
Kiali supports role-based access control (RBAC) when using any authentication strategy other than anonymous.
Although the anonymous strategy does not support RBAC, you can still limit privileges if using an OpenShift cluster. See the
access control section in Anonymous strategy.
Kiali uses the RBAC capabilities of the underlying cluster. Thus, RBAC is accomplished by using the standard RBAC features of the cluster, which is through ClusterRoles, ClusterRoleBindings, Roles and RoleBindings resources. Read the Kubernetes RBAC documentation for details. If you are using OpenShift, read the OpenShift RBAC documentation.
In general, Kiali will give access to the resources granted to the account used to login. Specifically, depending on the authentication strategy, this translates to:
| Authentication Strategy | Access To |
|---|---|
header |
resources granted to the user of the header-supplied token |
openid |
resources granted to the user of the third-party authentication system |
openshift |
resources granted to the OpenShift user |
token |
resources granted to the ServiceAccount token used to login |
For example, if you are using the token strategy, you would grant
cluster-wide privileges to a ServiceAccount with this command:
$ kubectl create clusterrolebinding john-binding --clusterrole=kiali --serviceaccount=mynamespace:john
and if you are using openshift or openid strategies, you could assign
privileges with any of these commands:
$ kubectl create rolebinding john-openid-binding --clusterrole=kiali --user="john@example.com" --namespace=mynamespace
$ oc adm policy add-role-to-user kiali john -n mynamespace # For OpenShift clusters
Please read your cluster RBAC documentation to learn how to assign privileges.
Minimum required privileges to login
The get namespace privilege in some namespace is the minimum privilege needed
in order to be able to login to Kiali. This means you need the following
minimal Role bound to the user that wants to login:
apiVersion: rbac.authorization.k8s.io/v1
kind: Role
rules:
- apiGroups: [""]
  resources:
  - namespaces
  verbs:
  - get
This minimal Role will allow a user to login. Kiali may work partially, but
some pages may be blank or show erroneous information, and errors will be
logged constantly. You will need a broader set of privileges so that Kiali
works fine.
Privileges required for Kiali to work correctly
The default installation of Kiali creates a ClusterRole with the needed
privileges to take the most advantage of all Kiali features. Inspect the
privileges with
kubectl describe clusterrole kiali
view_only_mode: true
option, the ClusterRole will be named kiali-viewer instead of kiali.
Alternatively, check in the Kiali Operator source code. See either the Kubernetes role.yaml template file, or the OpenShift role.yaml template file.
You can use this ClusterRole to assign privileges to users requiring access
to Kiali. You can assign privileges either in one namespace, which will result in
users being able to see only resources in that namespace; or assign
cluster-wide privileges.
For example, to assign privileges to the john user and limiting access to the
myApp namespace, you could run either:
$ kubectl create rolebinding john-binding --clusterrole=kiali --user="john" --namespace=myApp
$ oc adm policy add-role-to-user kiali john -n myApp # For OpenShift clusters
But if you need to assign cluster-wide privileges, you could run either:
$ kubectl create clusterrolebinding john-admin-binding --clusterrole=kiali --user="john"
$ oc adm policy add-cluster-role-to-user kiali john # For OpenShift clusters
In case you need to assign a more limited set of privileges than the ones
present in the Kiali ClusterRole, create your own ClusterRole or Role
based off the privileges in Kiali’s ClusterRole and remove the privileges you
want to ban. You must understand that some Kiali features may not work properly
because of the reduced privilege set.
kiali or the kiali-viewer
ClusterRoles because they are bound to the Kiali ServiceAccount and editing
them may lead to Kiali not working properly.
2.9 - Traffic Health
There are times when Kiali’s default thresholds for traffic health do not work well for a particular situation. For example, at times 404 response codes are expected. Kiali has the ability to set powerful, fine-grained overrides for health configuration.
Default Configuration
By default Kiali uses the traffic rate configuration shown below. Application errors have minimal tolerance while client errors have a higher tolerance reflecting that some level of client errors is often normal (e.g. 404 Not Found):
- For http protocol 4xx are client errors and 5xx codes are application errors.
- For grpc protocol all 1-16 are errors (0 is success).
So, for example, if the rate of application errors is >= 0.1% Kiali will show Degraded health and if > 10% will show Failure health.
# ...
  health_config:
    rate:
      - namespace: ".*"
        kind: ".*"
        name: ".*"
        tolerance:
          - code: "^5\\d\\d$"
            direction: ".*"
            protocol: "http"
            degraded: 0
            failure: 10
          - code: "^4\\d\\d$"
            direction: ".*"
            protocol: "http"
            degraded: 10
            failure: 20
          - code: "^[1-9]$|^1[0-6]$"
            direction: ".*"
            protocol: "grpc"
            degraded: 0
            failure: 10
# ...
Custom Configuration
Custom health configuration is specified in the Kiali CR. To see the supported configuration syntax for health_config see the Kiali CR Reference.
Kiali applies the first matching rate configuration (namespace, kind, etc) and calculates the status for each tolerance. The reported health will be the status with highest priority (see below).
| Rate Option | Definition | Default | |||||||||||||||
|---|---|---|---|---|---|---|---|---|---|---|---|---|---|---|---|---|---|
| namespace | Matching Namespaces (regex) | .* (match all) | |||||||||||||||
| kind | Matching Resource Types (workload|app|service) (regex) | .* (match all) | |||||||||||||||
| name | Matching Resource Names (regex) | .* (match all) | |||||||||||||||
| tolerance | Array of tolerances to apply. | ||||||||||||||||
| Tolerance Option | Definition | Default |
|---|---|---|
| code | Matching Response Status Codes (regex) [1] | required |
| direction | Matching Request Directions (inbound|outbound) (regex) | .* (match all) |
| protocol | Matching Request Protocols (http|grpc) (regex) | .* (match all) |
| degraded | Degraded Threshold(% matching requests >= value) | 0 |
| failure | Failure Threshold (% matching requests >= value) | 0 |
[1] The status code typically depends on the request protocol. The special code -, a single dash, is used for requests that don’t receive a response, and therefore no response code.
Kiali reports traffic health with the following top-down status priority :
| Priority | Rule (value=% matching requests) | Status |
|---|---|---|
| 1 | value >= FAILURE threshold |  FAILURE FAILURE |
| 2 | value >= DEGRADED threshold AND value < FAILURE threshold |  DEGRADED DEGRADED |
| 3 | value > 0 AND value < DEGRADED threshold |  HEALTHY HEALTHY |
| 4 | value = 0 | HEALTHY |
| 5 | No traffic |  No Health Information No Health Information |
Examples
These examples use the repo https://github.com/kiali/demos/tree/master/error-rates.
In this repo we can see 2 namespaces: alpha and beta (Demo design).
| Alpha |
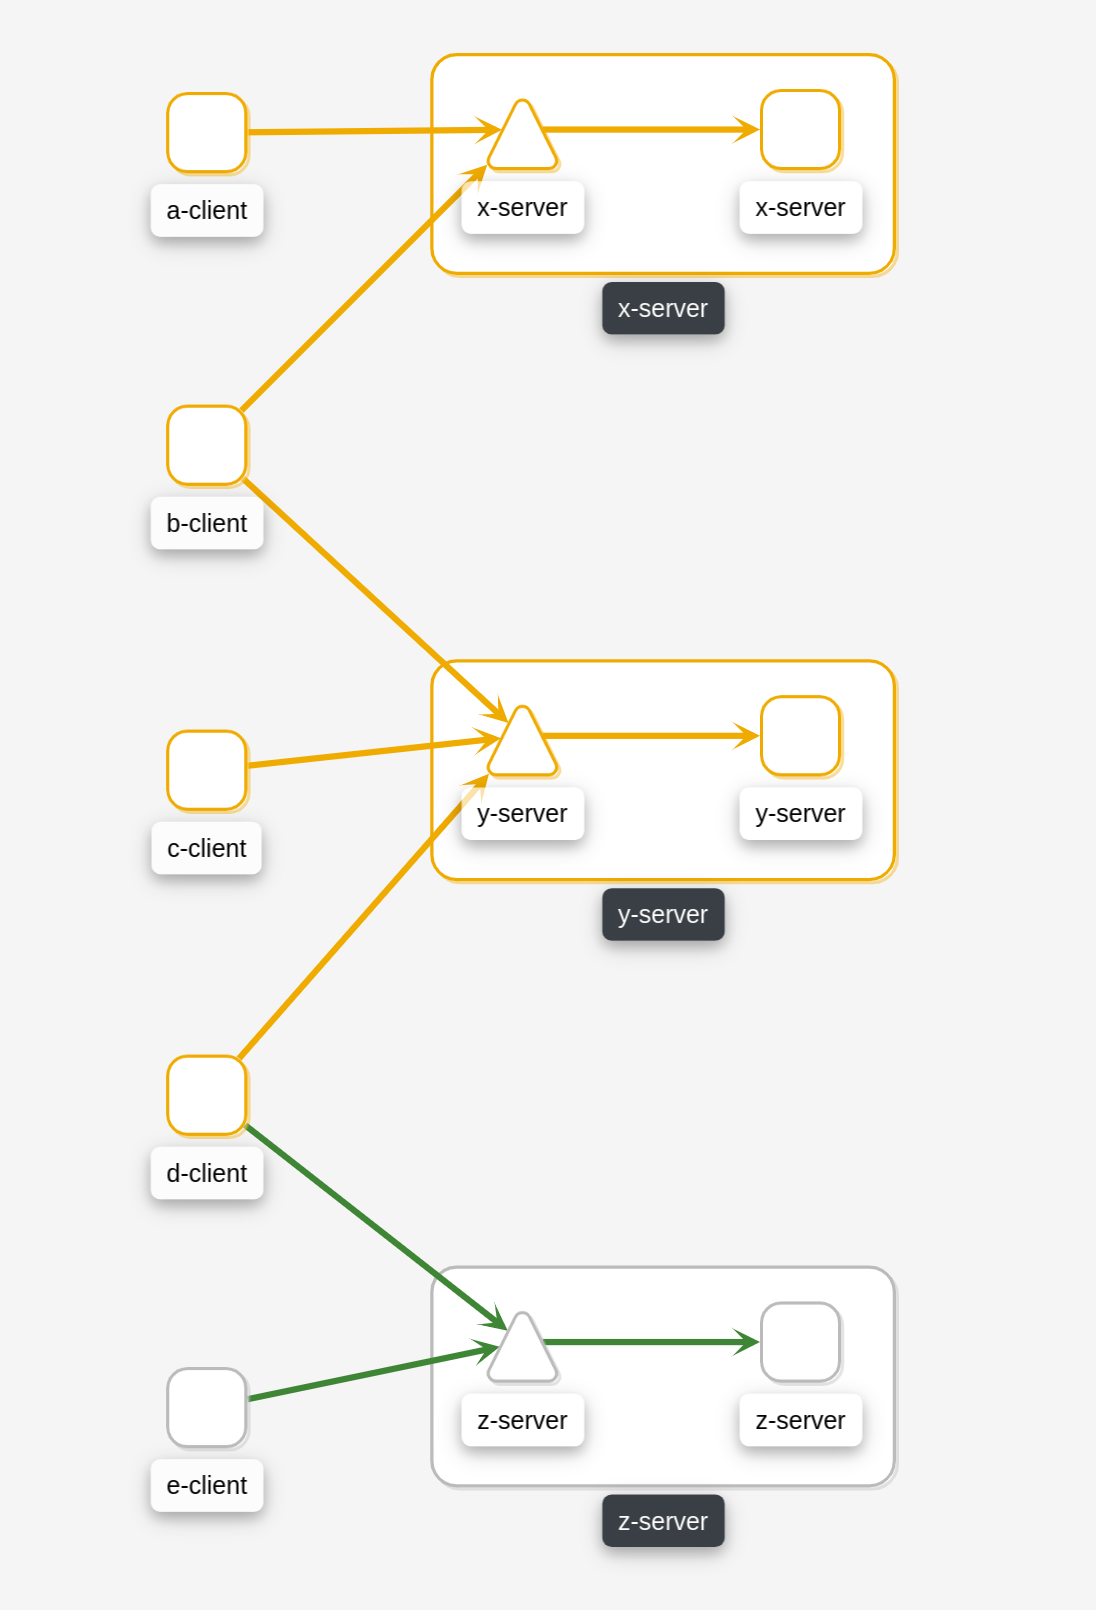
|
Where nodes return the responses (You can configure responses here):
| App (alpha/beta) | Code | Rate |
|---|---|---|
| x-server | 200 | 9 |
| x-server | 404 | 1 |
| y-server | 200 | 9 |
| y-server | 500 | 1 |
| z-server | 200 | 8 |
| z-server | 201 | 1 |
| z-server | 201 | 1 |
The applied traffic rate configuration is:
# ...
health_config:
  rate:
   - namespace: "alpha"
     tolerance:
       - code: "404"
         failure: 10
         protocol: "http"
       - code: "[45]\\d[^\\D4]"
         protocol: "http"
   - namespace: "beta"
     tolerance:
       - code: "[4]\\d\\d"
         degraded: 30
         failure: 40
         protocol: "http"
       - code: "[5]\\d\\d"
         protocol: "http"
# ...
After Kiali adds default configuration we have the following (Debug Info Kiali):
{
  "healthConfig": {
    "rate": [
      {
        "namespace": "/alpha/",
        "kind": "/.*/",
        "name": "/.*/",
        "tolerance": [
          {
            "code": "/404/",
            "degraded": 0,
            "failure": 10,
            "protocol": "/http/",
            "direction": "/.*/"
          },
          {
            "code": "/[45]\\d[^\\D4]/",
            "degraded": 0,
            "failure": 0,
            "protocol": "/http/",
            "direction": "/.*/"
          }
        ]
      },
      {
        "namespace": "/beta/",
        "kind": "/.*/",
        "name": "/.*/",
        "tolerance": [
          {
            "code": "/[4]\\d\\d/",
            "degraded": 30,
            "failure": 40,
            "protocol": "/http/",
            "direction": "/.*/"
          },
          {
            "code": "/[5]\\d\\d/",
            "degraded": 0,
            "failure": 0,
            "protocol": "/http/",
            "direction": "/.*/"
          }
        ]
      },
      {
        "namespace": "/.*/",
        "kind": "/.*/",
        "name": "/.*/",
        "tolerance": [
          {
            "code": "/^5\\d\\d$/",
            "degraded": 0,
            "failure": 10,
            "protocol": "/http/",
            "direction": "/.*/"
          },
          {
            "code": "/^4\\d\\d$/",
            "degraded": 10,
            "failure": 20,
            "protocol": "/http/",
            "direction": "/.*/"
          },
          {
            "code": "/^[1-9]$|^1[0-6]$/",
            "degraded": 0,
            "failure": 10,
            "protocol": "/grpc/",
            "direction": "/.*/"
          }
        ]
      }
    ]
  }
}
What are we applying?
-
For namespace alpha, all resources
-
Protocol http if % requests with error code 404 are >= 10 then FAILURE, if they are > 0 then DEGRADED
-
Protocol http if % requests with others error codes are> 0 then FAILURE.
-
For namespace beta, all resources
-
Protocol http if % requests with error code 4xx are >= 40 then FAILURE, if they are >= 30 then DEGRADED
-
Protocol http if % requests with error code 5xx are > 0 then FAILURE
-
For other namespaces Kiali will apply the defaults.
-
Protocol http if % requests with error code 5xx are >= 20 then FAILURE, if they are >= 0.1 then DEGRADED
-
Protocol grpc if % requests with error code match /^[1-9]$|^1[0-6]$/ are >= 20 then FAILURE, if they are >= 0.1 then DEGRADED
| Alpha | Beta |
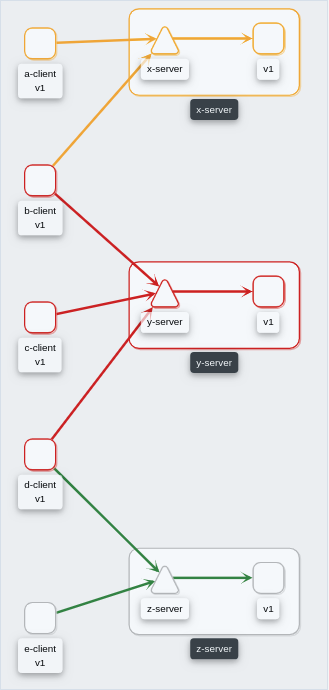 |
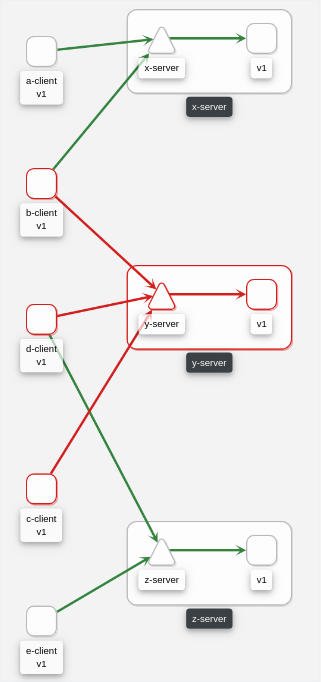 |
2.10 - Virtual Machine workloads
Introduction
Kiali graph visualizes both Virtual Machine workloads (WorkloadEntry) and pod-based workloads, running inside a Kubernetes cluster. You must ensure that the Istio Proxy is running, and correctly configured, on the Virtual Machine. Also, Prometheus must be able to scrape the metrics endpoint of the Istio Proxy running on the VM. Kiali will then be able to read the traffic telemetry for the Virtual Machine workloads, and incorporate the VM workloads into the graph.
Configuring Prometheus to scrape VM-based Istio Proxy
Once the Istio Proxy is running on a Virtual Machine, configuring Prometheus to scrape the VM’s Istio Proxy metrics endpoint is the only configuration Kiali needs to display traffic for the VM-based workload. Configuring Prometheus will vary between environments. Here is a very simple example of a Prometheus configuration that includes a job to scrape VM based workloads:
- job_name: bookinfo-vms
  honor_timestamps: true
  scrape_interval: 15s
  scrape_timeout: 10s
  metrics_path: /stats/prometheus
  scheme: http
  follow_redirects: true
  static_configs:
  - targets:
    - details-v1:15020
    - productpage-v1:15020
    - ratings-v1:15020
    - reviews-v1:15020
    - reviews-v2:15020
    - reviews-v3:15020
3 - Features
3.1 - Application Wizards
Istio Application Wizards
Kiali provides Actions to create, update and delete Istio configuration, driven by wizards.
Actions can be applied to a Service

Actions can also be applied to a Workload

And, actions are available for an entire Namespace

Service Actions
Kiali offers a robust set of service actions, with accompanying wizards.
Traffic Management: Request Routing
The Request Routing Wizard allows creating multiple routing rules.
- Every rule is composed of a Request Matching and a Routes To section.
- The Request Matching section can add multiple filters using HEADERS, URI, SCHEME, METHOD or AUTHORITY HTTP parameters.
- The Request Matching section can be empty, in this case any HTTP request received is matched against this rule.
- The Routes To section can specify the percentage of traffic that is routed to a specific workload.

Istio applies routing rules in order, meaning that the first rule matching an HTTP request (top-down) performs the routing. The Matching Routing Wizard allows changing the rule order.
Traffic Management: Fault Injection
The Fault Injection Wizard allows injecting faults to test the resiliency of a Service.
- HTTP Delay specification is used to inject latency into the request forwarding path.
- HTTP Abort specification is used to immediately abort a request and return a pre-specified status code.

Traffic Management: Traffic Shifting
The Traffic Shifting Wizard allows selecting the percentage of traffic that is routed to a specific workload.

Traffic Management: Request Timeouts
The Request Timeouts Wizard sets up request timeouts in Envoy, using Istio.
- HTTP Timeout defines the timeout for a request.
- HTTP Retry describes the retry policy to use when an HTTP request fails.

Traffic Management: Gateways
Traffic Management Wizards have an Advanced Options section that can be used to extend the scenario.
One available Advanced Option is to expose a Service to external traffic through an existing Gateway or to create a new Gateway for this Service.

Traffic Management: Circuit Breaker
Traffic Management Wizards allows defining Circuit Breakers on Services as part of the available Advanced Options.
- Connection Pool defines the connection limits for an upstream host.
- Outlier Detection implements the Circuit Breaker based on the consecutive errors reported.

Security: Traffic Policy
Traffic Management Advanced Options allows defining Security and Load Balancing settings.
- TLS related settings for connections to the upstream service.
- Automatically generate a PeerAuthentication resource for this Service.
- Load balancing policies to apply for a specific destination.

Workload Actions
Automatic Sidecar Injection
A Workload can be individually managed to control the Sidecar Injection.
A default scenario is to indicate this at Namespace level but there can be cases where a Workload shouldn’t be part of the Mesh or vice versa.
Kiali allows users to alter the Deployment template and propagate this configuration into the Pods.

Namespace Actions
The Kiali Overview page offers several Namespace actions, in any of its views: Expanded, Compacted or Table.
Show
Show actions navigate from a Namespace to its specific Graph, Applications, Workloads, Services or Istio Config pages.
Automatic Sidecar Injection
When Automatic Sidecar Injection is enabled in the cluster, a Namespace can be labeled to enable/disable the injection webhook, controlling whether new deployments will automatically have a sidecar.
Canary Istio upgrade
When Istio Canary revision is installed, a Namespace can be labeled to that canary revision, so the sidecar of canary revision will be injected into workloads of the namespace.
Security: Traffic Policies
Kiali can generate Traffic Policies based on the traffic for a namespace.
For example, at some point a namespace presents a traffic graph like this:

And a user may want to add Traffic Policies to secure that communication. In other words, to prevent traffic other than that currently reflected in the Graph’s Services and Workloads.
Using the Create Traffic Policies action on a namespace, Kiali will generate AuthorizationPolicy resources per every Workload in the Namespace.

3.2 - Detail Views
Kiali provides filtered list views of all your service mesh definitions. Each view provides health, details, YAML definitions and links to help you visualize your mesh. There are list and detail views for:
- Applications
- Istio Configuration
- Services
- Workloads
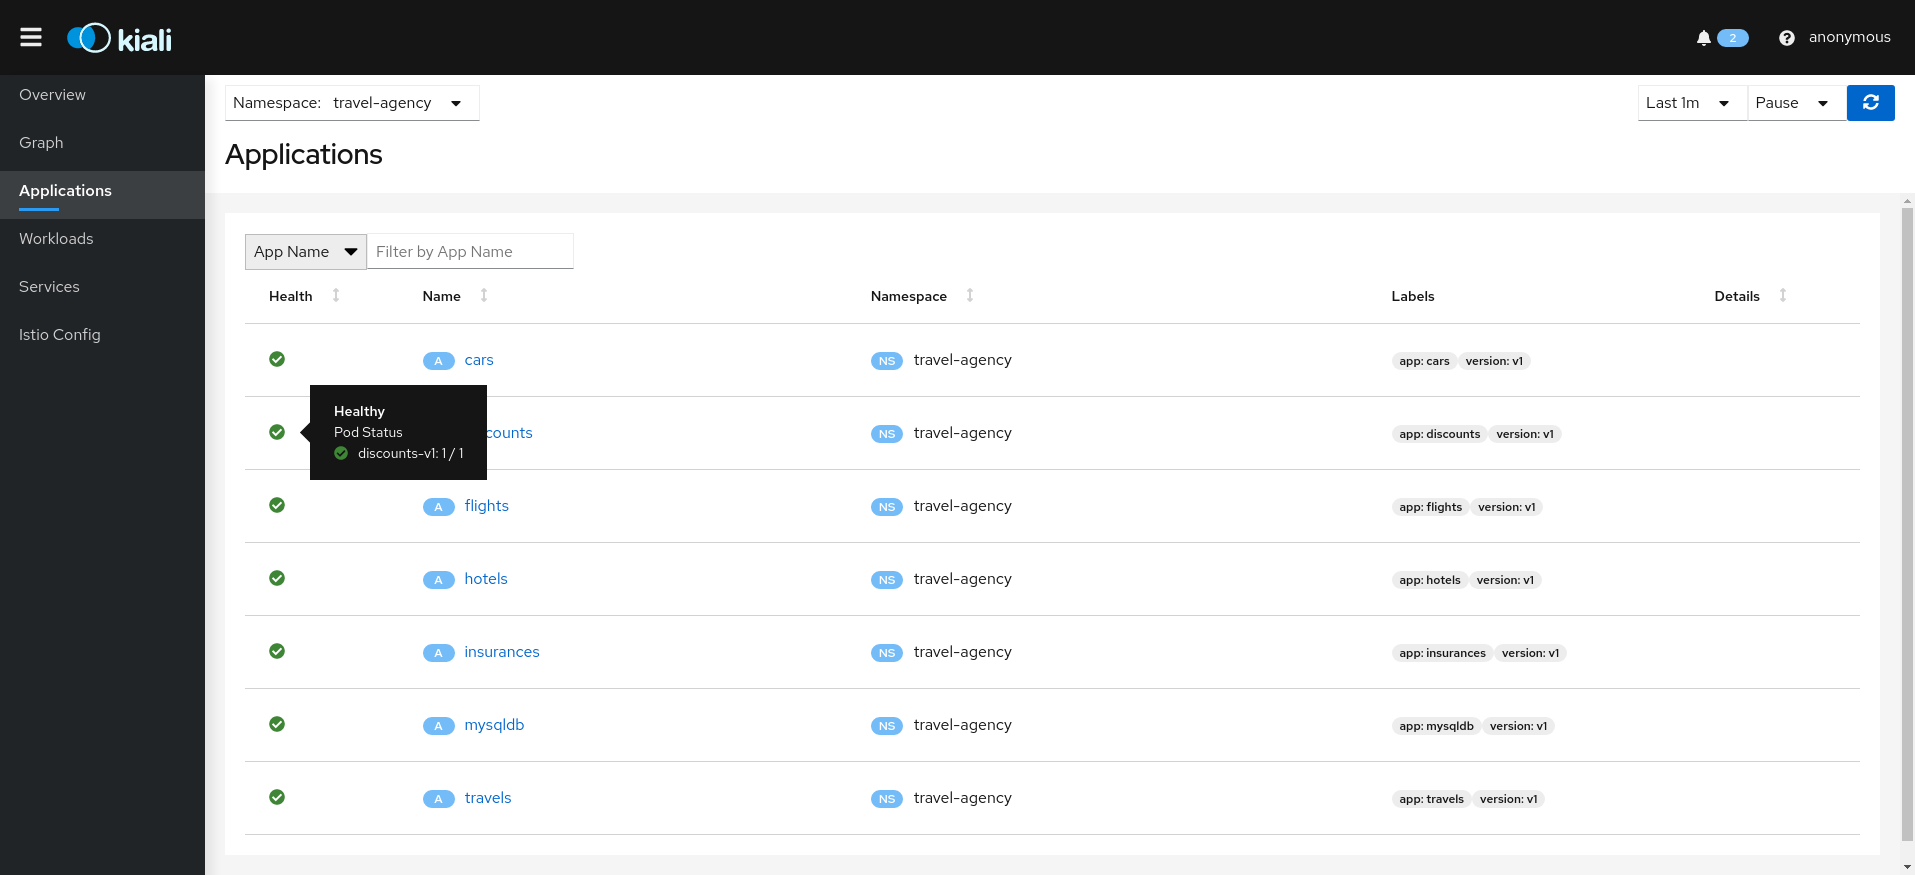
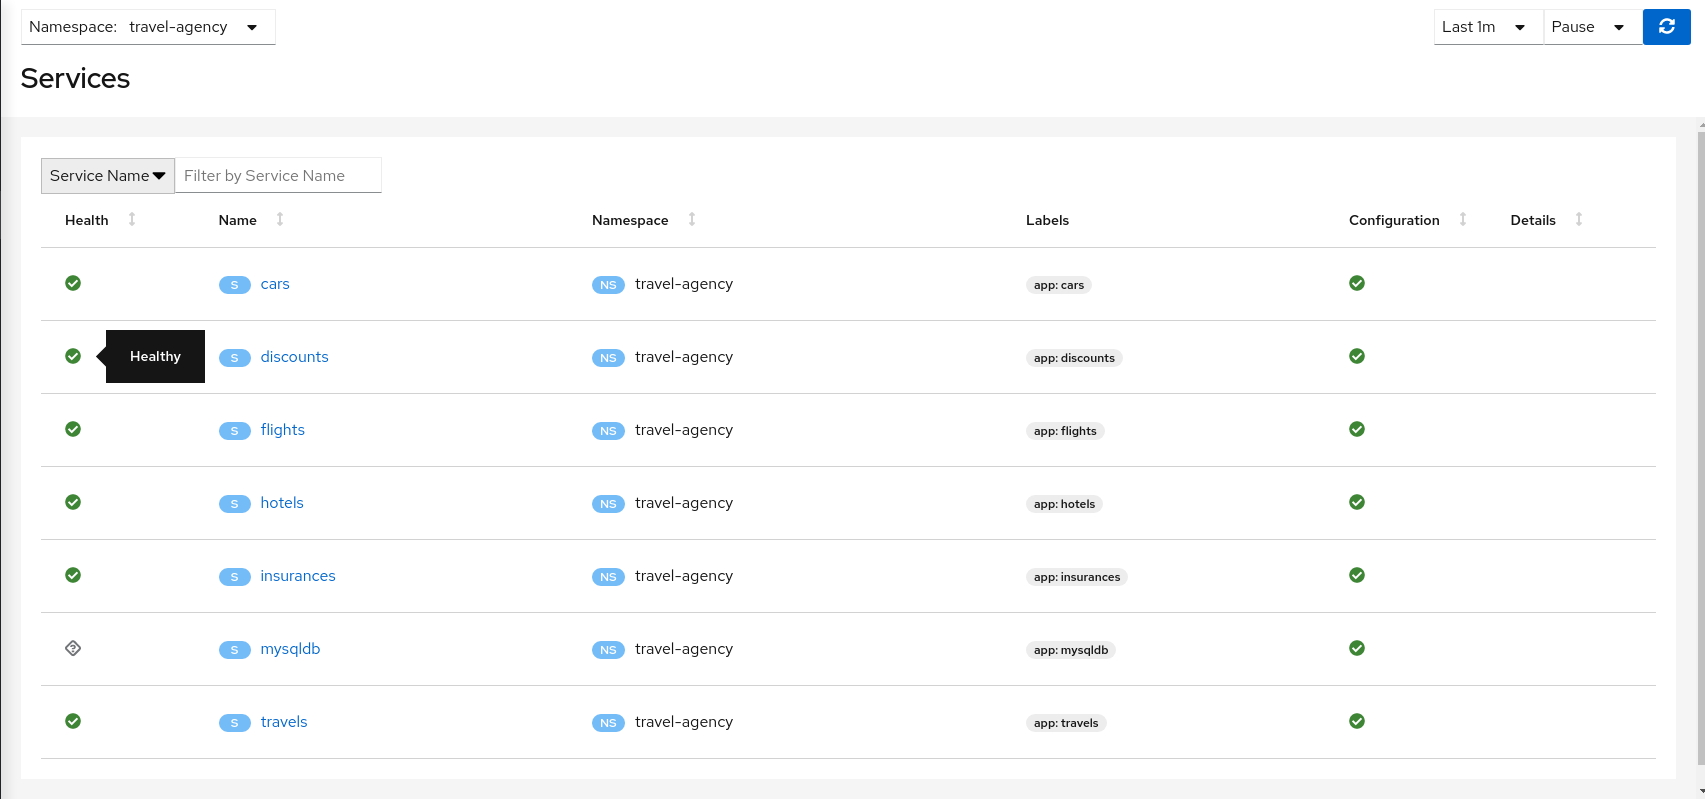
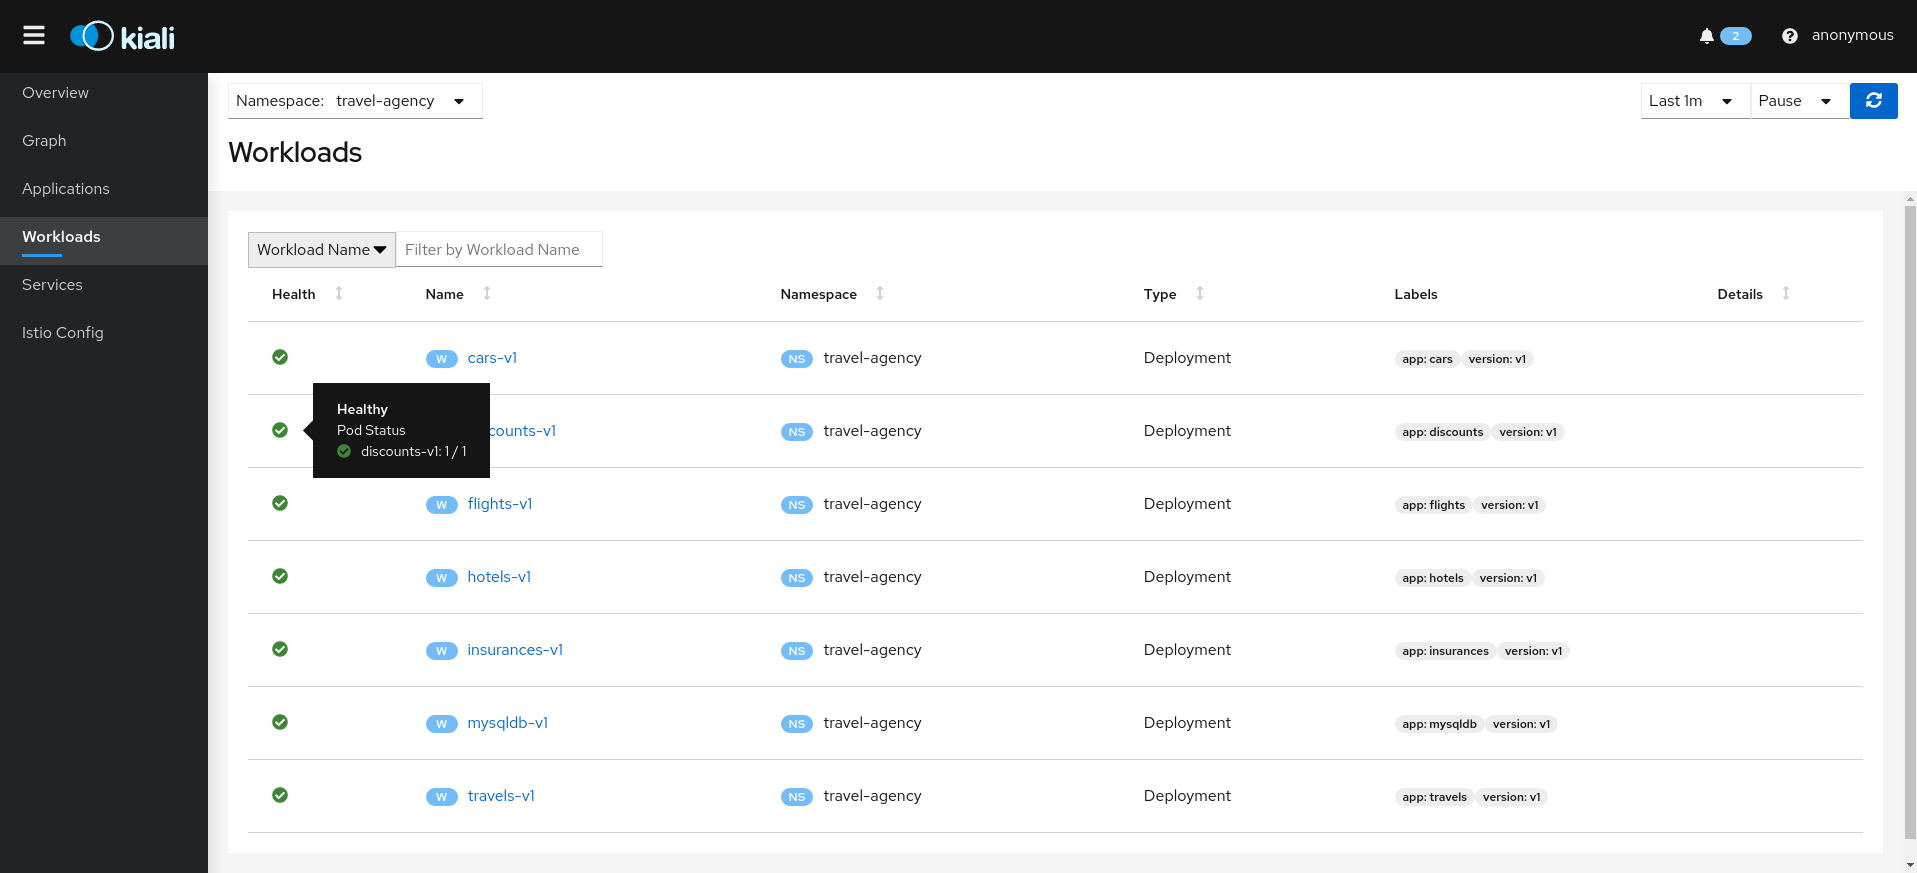
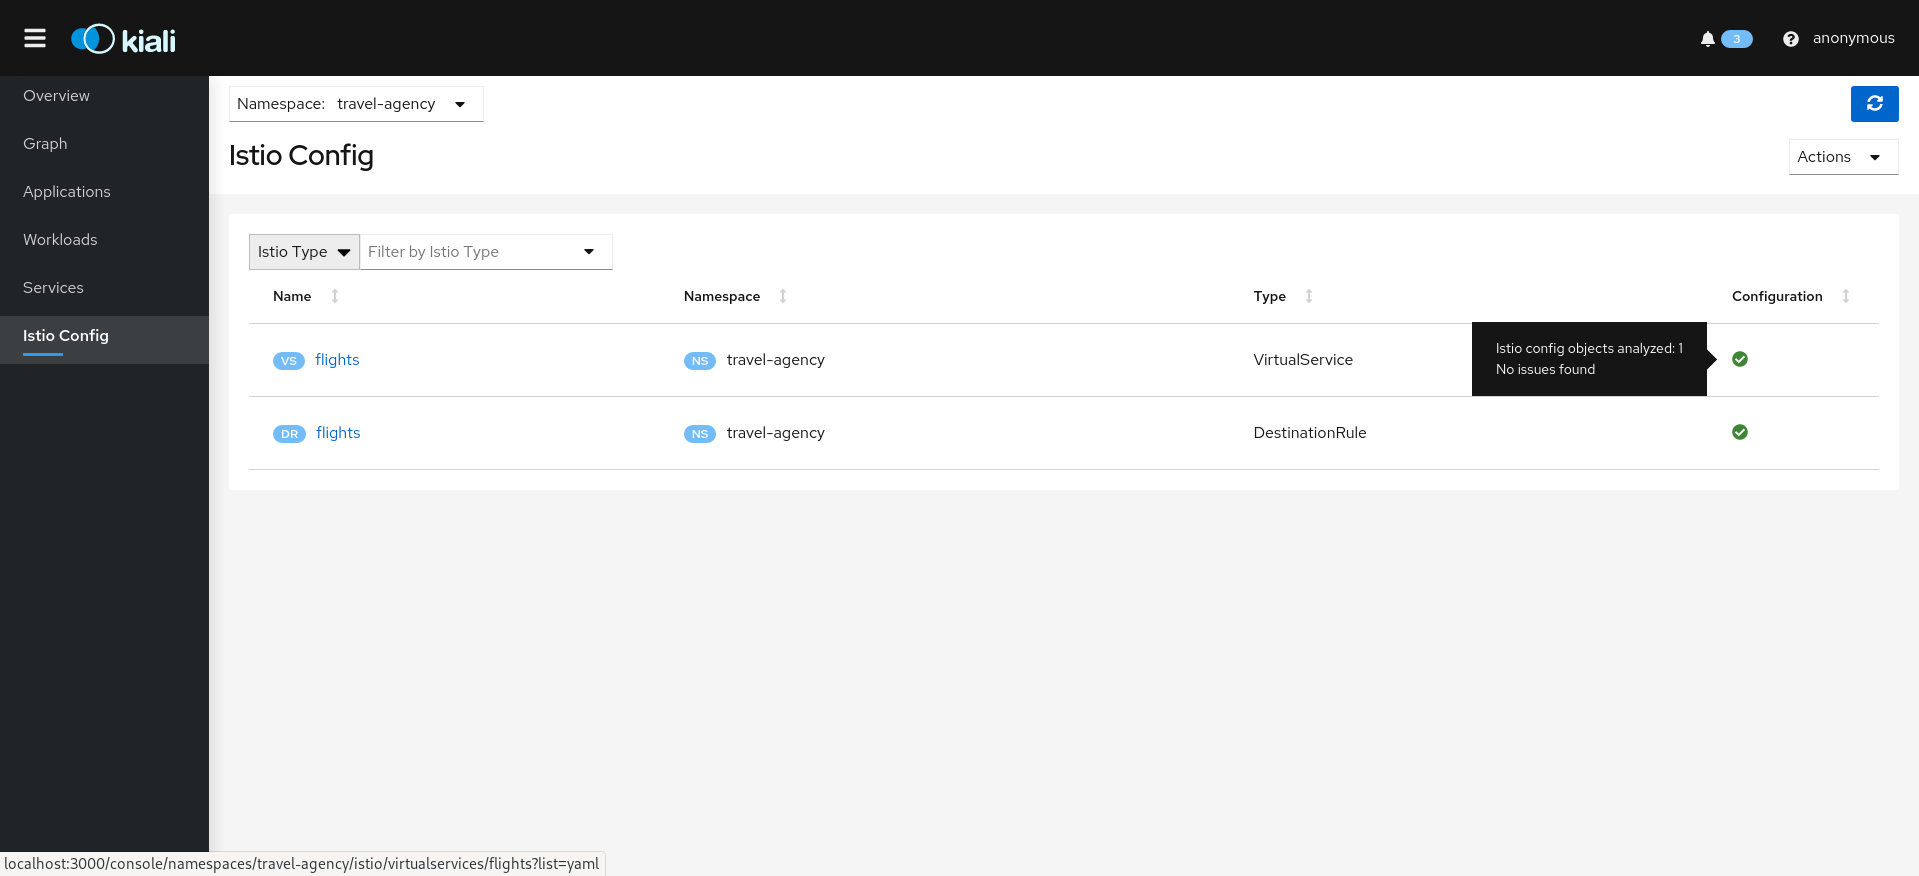
Selecting an object from the list will bring you to its detail page. For Istio Config, Kiali will present its YAML, along with contextual validation information. Other mesh components present a variety of Tabs.
Overview Tab
Overview is the default Tab for any detail page. The overview tab provides detailed information, including health status, and a detailed mini-graph of the current traffic involving the component. The full set of tabs, as well as the detailed information, varies based on the component type.
Each Overview provides:
- links to related components and linked Istio configuration.
- health status.
- validation information.
- an Action menu for actions that can be taken on the component.
- several Wizards are available.
And also type-specfic information. For example:
- Service detail includes Network information.
- Workload detail provides backing Pod information.
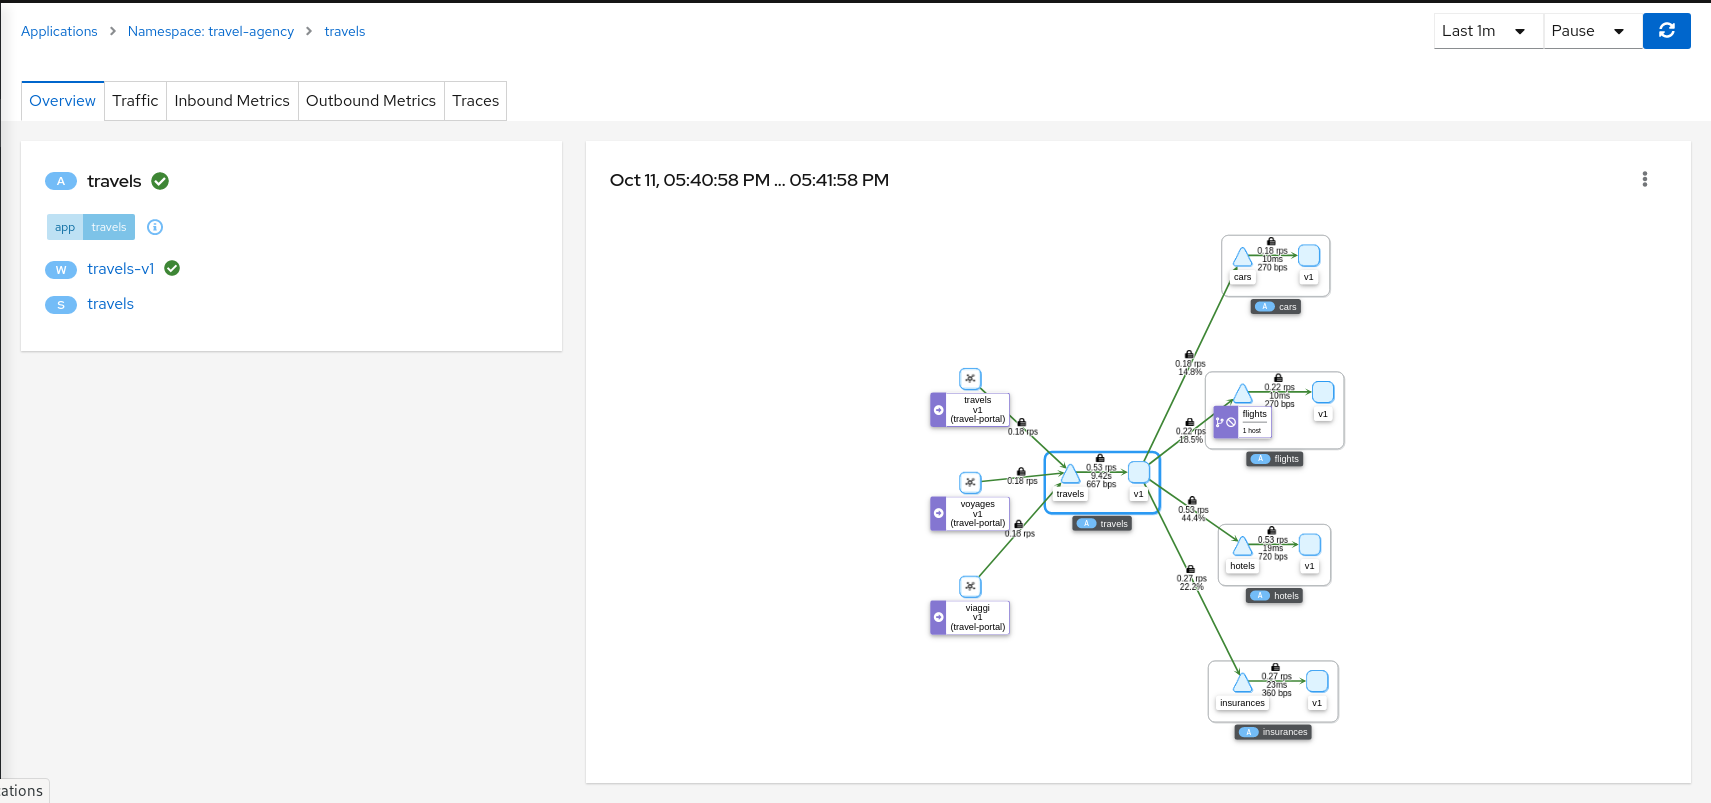
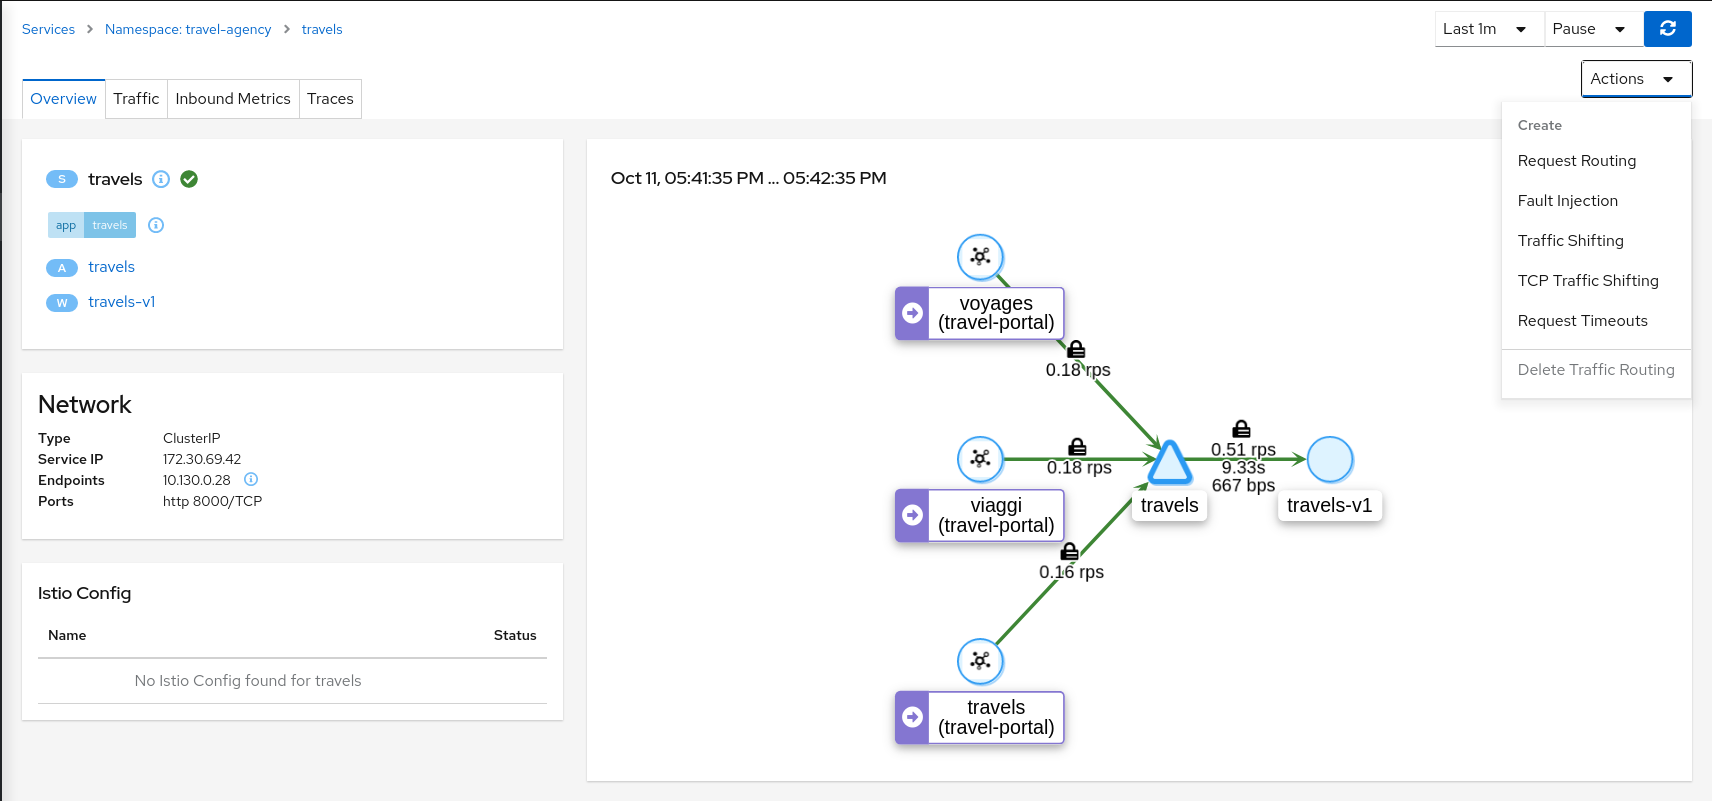
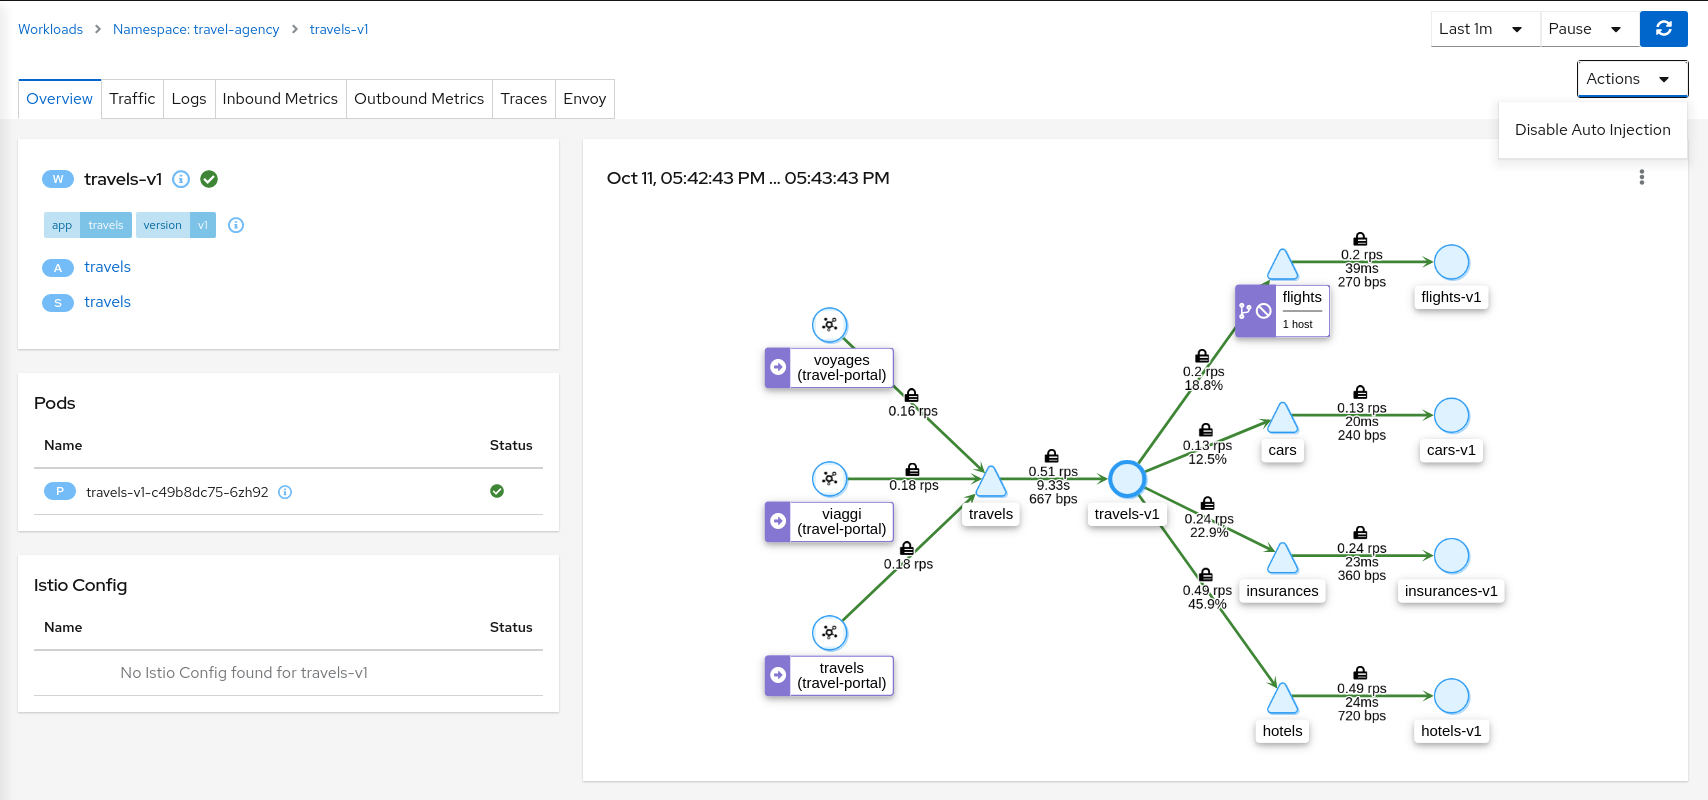
Both Workload and Service detail can be customized to some extent, by adding additional details supplied as annotations. This is done through the additional_display_details field in the Kiali CR.
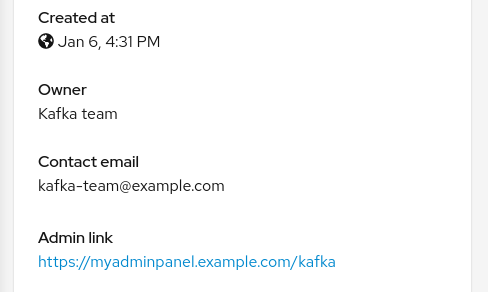
Traffic
The Traffic Tab presents a service, app, or workload’s Inbound and Outbound traffic in a table-oriented way:
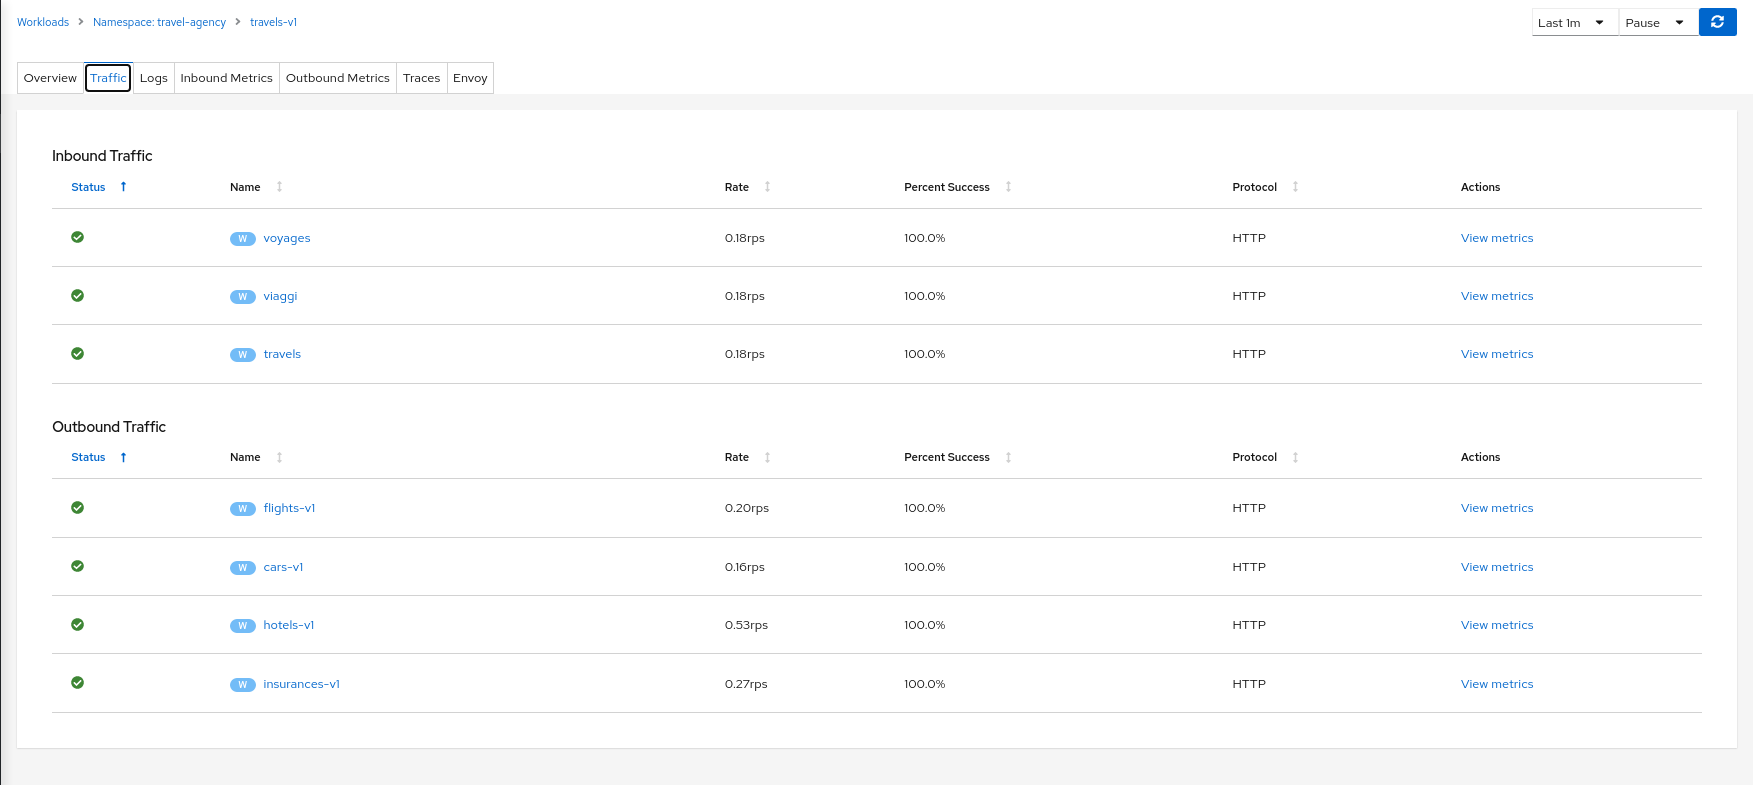
Logs
Workload detail offers a special Logs tab. Kiali offers a special unified logs view that lets users correlate app and proxy logs. It can also add-in trace span information to help identify important traces based on associated logging. More powerful features include substring or regex Show/Hide, full-screen, and the ability to set proxy log level without a pod restart.
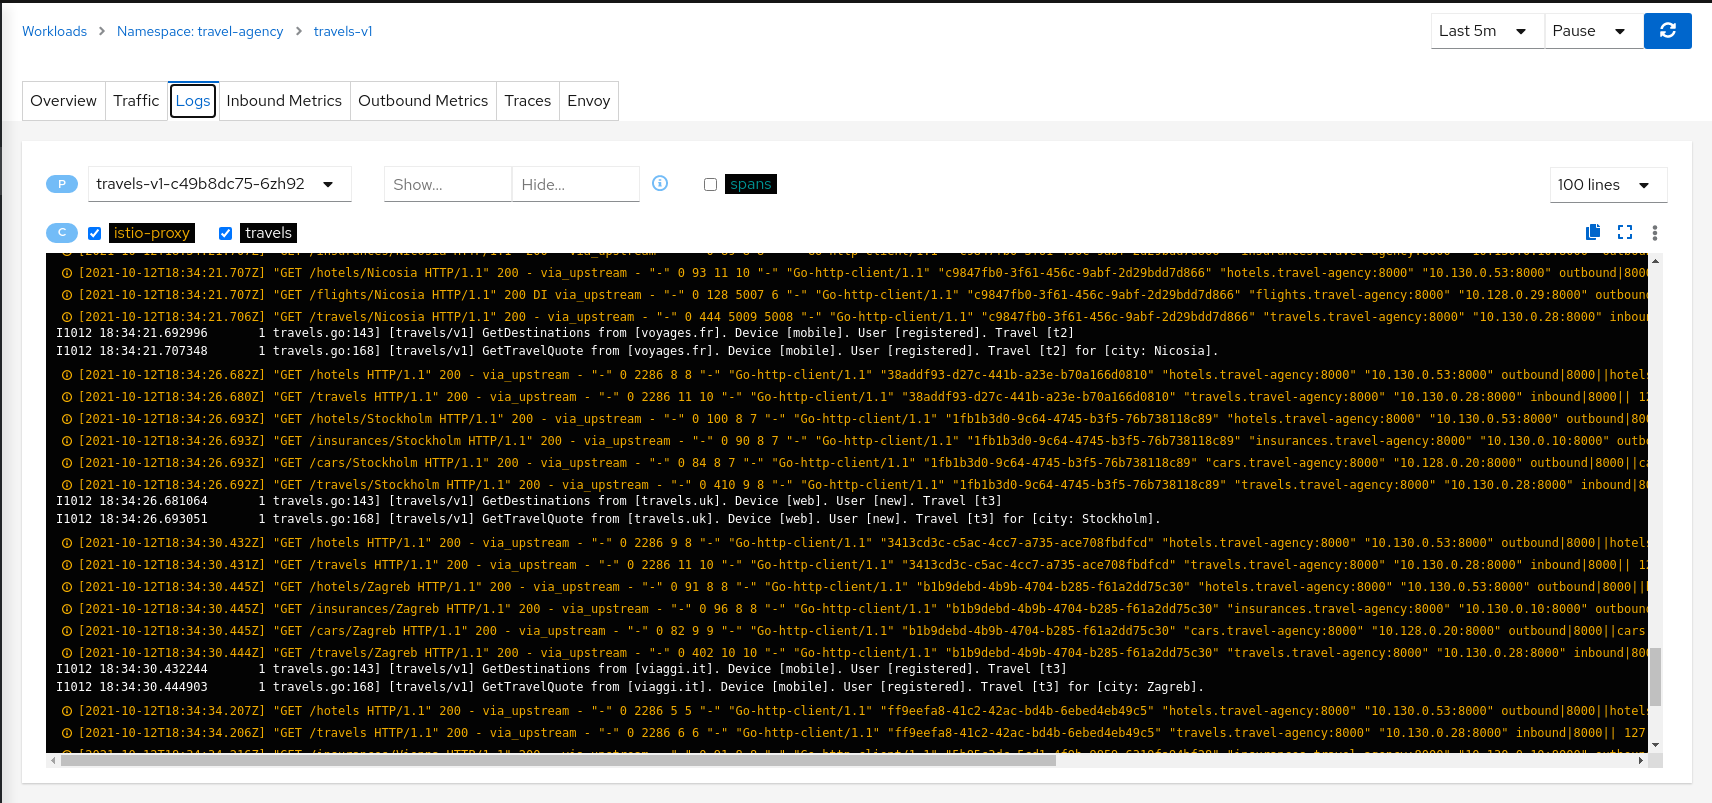
Metrics
Each detail view provides Inbound Metrics and/or Outbound Metrics tabs, offering predefined metric dashboards. The dashboards provided are tailored to the relevant application, workload or service level. Application and workload detail views show request and response metrics such as volume, duration, size, or tcp traffic. The service detail view shows request and response metrics for inbound traffic only.
Kiali allows the user to customize the charts by choosing the charted dimensions. It can also present metrics reported by either source or destination proxy metrics. And for troublshooting it can overlay trace spans.
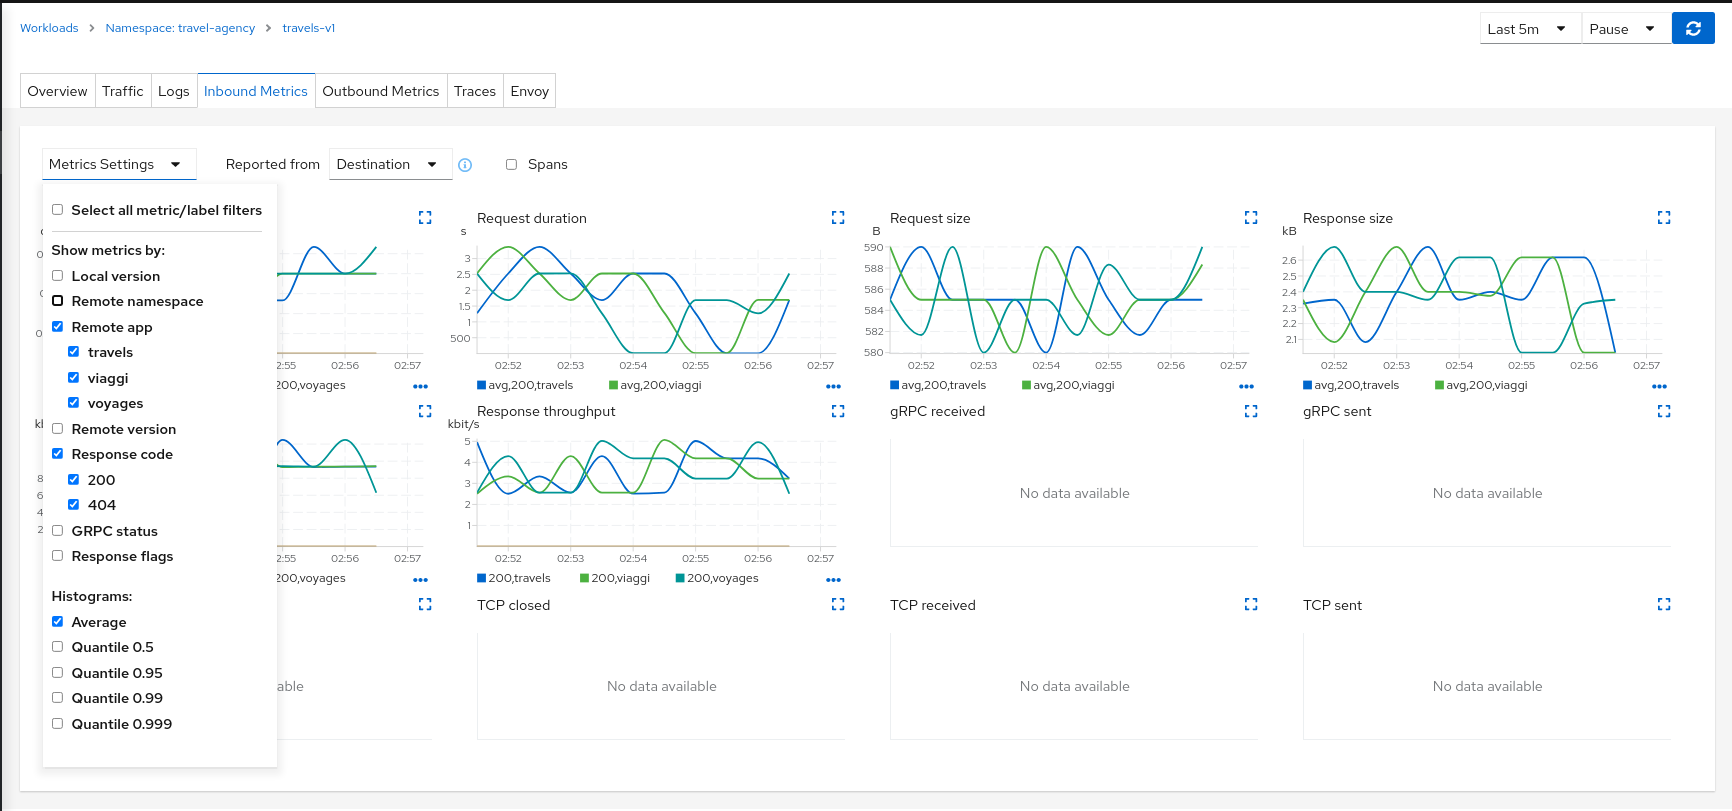
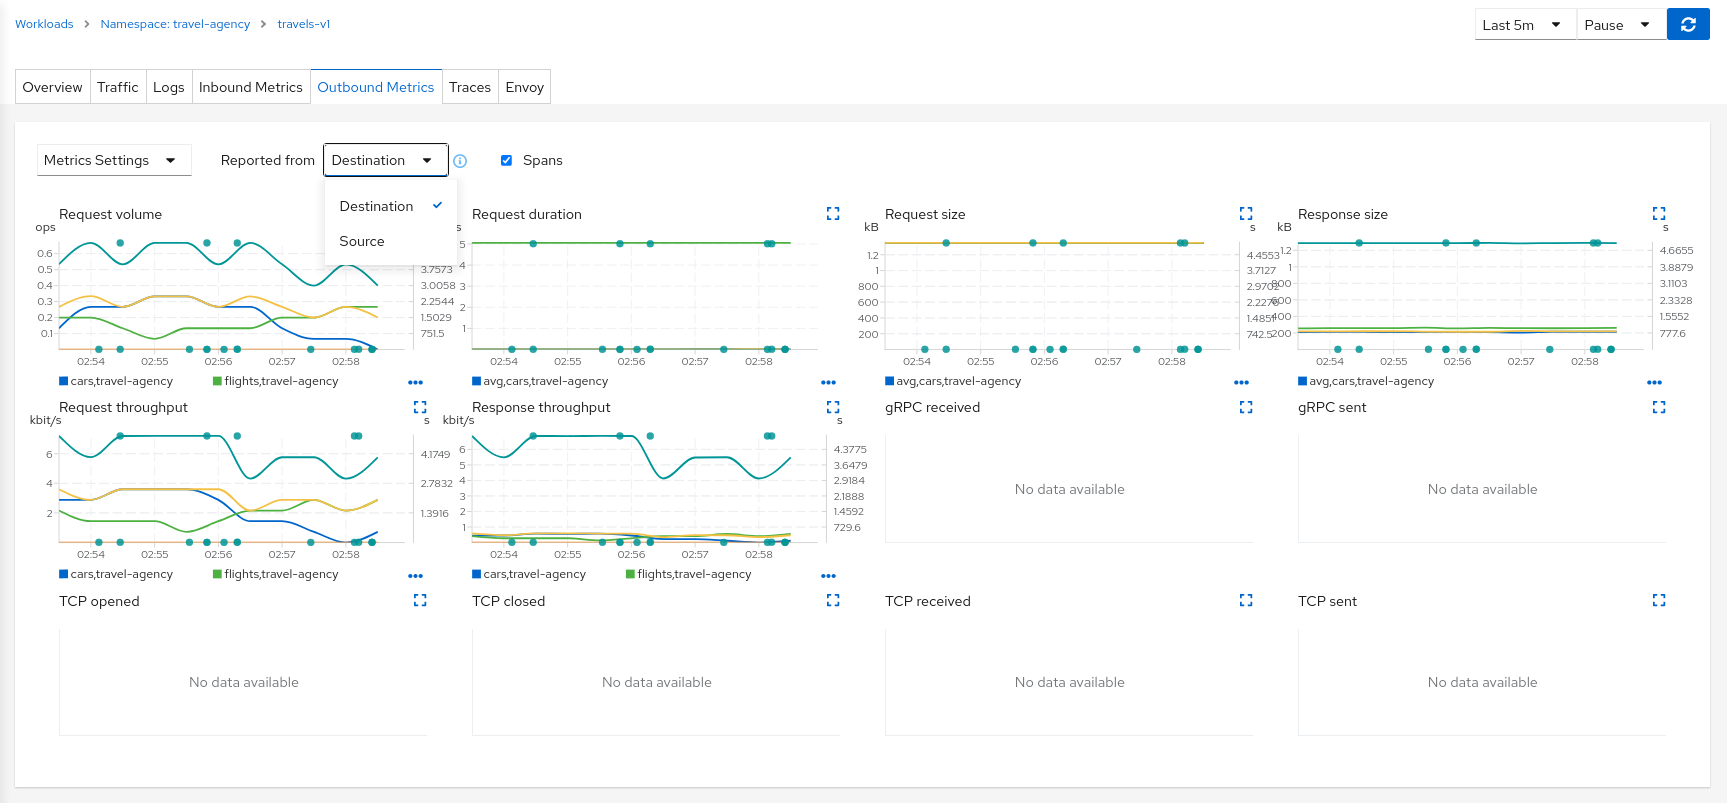
Traces
Each detail view provides a Traces tab with a native integration with Jaeger. For more, see Tracing.
Dashboards
Kiali will display additional tabs for each applicable Built-In Dashboard or Custom Dashboard.
Built-in dashboards
Kiali comes with built-in dashboards for several runtimes, including Envoy, Go, Node.js, and others.
Envoy
The most important built-in dashboard is for Envoy. Kiali offers the Envoy tab for many workloads. The Envoy tab is actually a Built-In Dashboard, but it is very common as it applies to any workload injected with, or that is itself, an Envoy proxy. Being able to inspect the Envoy proxy is invaluable when troublshooting your mesh. The Envoy tab itself offers five subtabs, exposing a wealth of information.
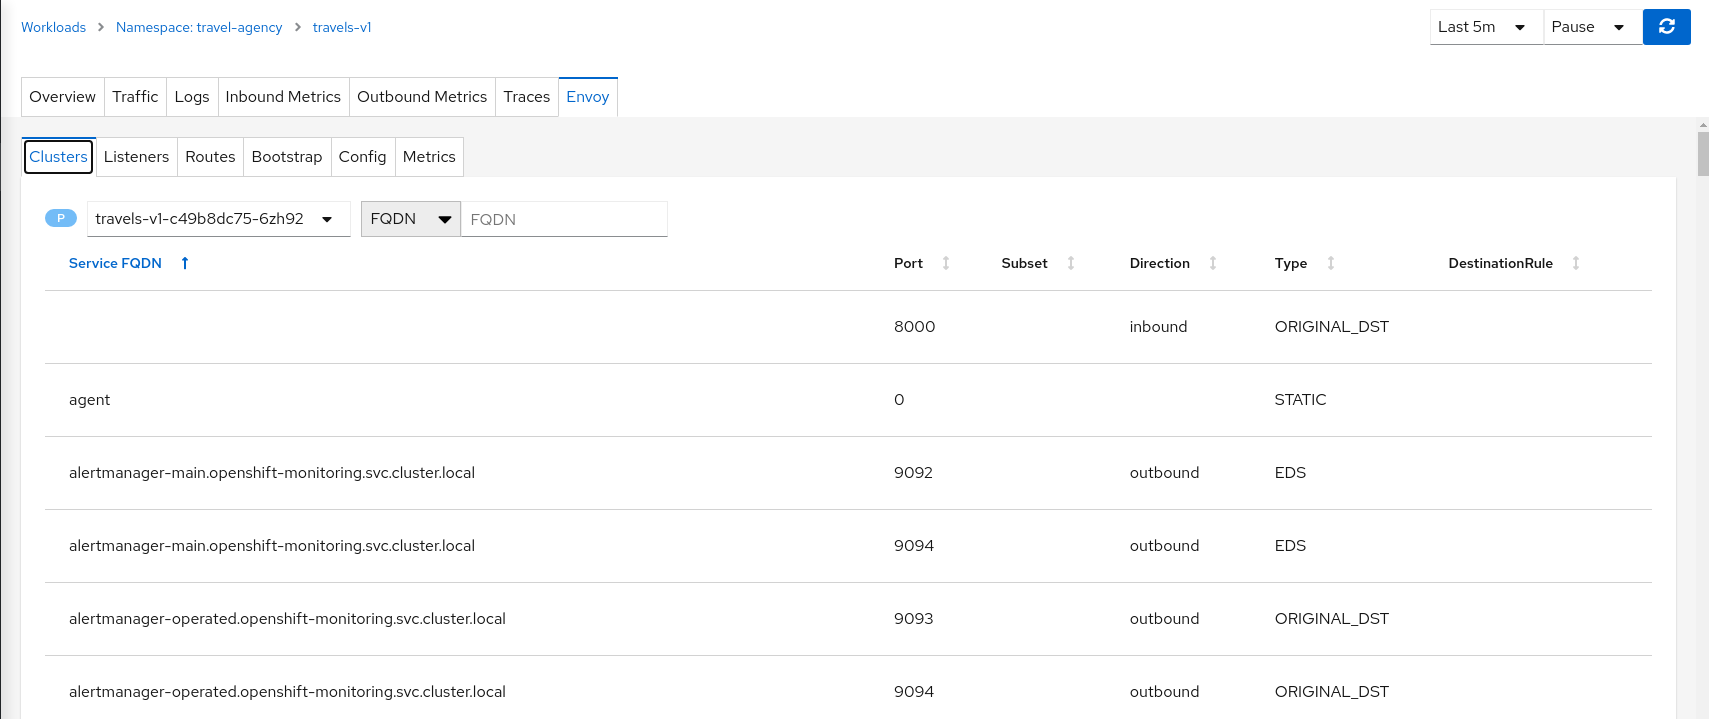
Istio’s Envoy sidecars supply some internal metrics, that can be viewed in Kiali. They are different than the metrics reported by Istio Telemetry, which Kiali uses extensively. Some of Envoy’s metrics may be redundant.
Note that the enabled Envoy metrics can be tuned, as explained in the Istio documentation: it’s possible to get more metrics using the statsInclusionPrefixes annotation. Make sure you include cluster_manager and listener_manager as they are required.
For example, sidecar.istio.io/statsInclusionPrefixes: cluster_manager,listener_manager,listener will add listener metrics for more inbound traffic information. You can then customize the Envoy dashboard of Kiali according to the collected metrics.
Go
Contains metrics such as the number of threads, goroutines, and heap usage. The expected metrics are provided by the Prometheus Go client.
Example to expose built-in Go metrics:
        http.Handle("/metrics", promhttp.Handler())
        http.ListenAndServe(":2112", nil)
As an example and for self-monitoring purpose Kiali itself exposes Go metrics.
The pod annotation for Kiali is: kiali.io/dashboards: go
Node.js
Contains metrics such as active handles, event loop lag, and heap usage. The expected metrics are provided by prom-client.
Example of Node.js metrics for Prometheus:
const client = require('prom-client');
client.collectDefaultMetrics();
// ...
app.get('/metrics', (request, response) => {
  response.set('Content-Type', client.register.contentType);
  response.send(client.register.metrics());
});
Full working example: https://github.com/jotak/bookinfo-runtimes/tree/master/ratings
The pod annotation for Kiali is: kiali.io/dashboards: nodejs
Quarkus
Contains JVM-related, GC usage metrics. The expected metrics can be provided by SmallRye Metrics, a MicroProfile Metrics implementation. Example with maven:
    <dependency>
      <groupId>io.quarkus</groupId>
      <artifactId>quarkus-smallrye-metrics</artifactId>
    </dependency>
The pod annotation for Kiali is: kiali.io/dashboards: quarkus
Spring Boot
Three dashboards are provided: one for JVM memory / threads, another for JVM buffer pools and the last one for Tomcat metrics. The expected metrics come from Spring Boot Actuator for Prometheus. Example with maven:
    <dependency>
      <groupId>org.springframework.boot</groupId>
      <artifactId>spring-boot-starter-actuator</artifactId>
    </dependency>
    <dependency>
      <groupId>io.micrometer</groupId>
      <artifactId>micrometer-core</artifactId>
    </dependency>
    <dependency>
      <groupId>io.micrometer</groupId>
      <artifactId>micrometer-registry-prometheus</artifactId>
    </dependency>
Full working example: https://github.com/jotak/bookinfo-runtimes/tree/master/details
The pod annotation for Kiali with the full list of dashboards is: kiali.io/dashboards: springboot-jvm,springboot-jvm-pool,springboot-tomcat
By default, the metrics are exposed on path /actuator/prometheus, so it must be specified in the corresponding annotation: prometheus.io/path: "/actuator/prometheus"
Thorntail
Contains mostly JVM-related metrics such as loaded classes count, memory usage, etc. The expected metrics are provided by the MicroProfile Metrics module. Example with maven:
    <dependency>
      <groupId>io.thorntail</groupId>
      <artifactId>microprofile-metrics</artifactId>
    </dependency>
Full working example: https://github.com/jotak/bookinfo-runtimes/tree/master/productpage
The pod annotation for Kiali is: kiali.io/dashboards: thorntail
Vert.x
Several dashboards are provided, related to different components in Vert.x: HTTP client/server metrics, Net client/server metrics, Pools usage, Eventbus metrics and JVM. The expected metrics are provided by the vertx-micrometer-metrics module. Example with maven:
    <dependency>
      <groupId>io.vertx</groupId>
      <artifactId>vertx-micrometer-metrics</artifactId>
    </dependency>
    <dependency>
      <groupId>io.micrometer</groupId>
      <artifactId>micrometer-registry-prometheus</artifactId>
    </dependency>
Init example of Vert.x metrics, starting a dedicated server (other options are possible):
      VertxOptions opts = new VertxOptions().setMetricsOptions(new MicrometerMetricsOptions()
          .setPrometheusOptions(new VertxPrometheusOptions()
              .setStartEmbeddedServer(true)
              .setEmbeddedServerOptions(new HttpServerOptions().setPort(9090))
              .setPublishQuantiles(true)
              .setEnabled(true))
          .setEnabled(true));
Full working example: https://github.com/jotak/bookinfo-runtimes/tree/master/reviews
The pod annotation for Kiali with the full list of dashboards is: kiali.io/dashboards: vertx-client,vertx-server,vertx-eventbus,vertx-pool,vertx-jvm
Custom Dashboards
When the built-in dashboards don’t offer what you need, it’s possible to create your own. See Custom Dashboard Configuration for more information.
3.3 - Health
Kiali help users know whether their service mesh is healthy. This includes the health of the mesh infrastructure itself, and the deployed application services.
Service Mesh Infrastructure Health
Users can quickly confirm the health of their infrastructure by looking at the Kiali Masthead. If Kiali detects any health issues with the infrastructure of the mesh it will show an indication in the masthead, severity will be reflected via color, and hovring will show the detail:

For more detail on how Kiali tracks the Istio infrastructure status, see the Istio Status Feature.
Overview Health
The default Kiali page is an Overview Dashboard. This view will quickly allow you to identify namespaces with issues. It provides a summary of configuration health, component health and request traffic health. The component health is selectable via a dropdown and the page offers various filter, sort and presentation options:

Graph Health
The Kiali Graph offers a rich visualization of your service mesh traffic. The health of Nodes and Edges is represented via a standard color system using shades of orange and red to reflect degraded and failure-level traffic health. Red or orange nodes or edges may need attention. The color of an edge represents the request health between the relevant nodes. Note that node shape indicates the type of component, such as service, workload, or app.
The health of nodes and edges is refreshed automatically based on the user’s preference. The graph can also be paused to examine a particular state, or replayed to re-examine a particular time period.

Health Configuration
Kiali calculates health by combining the individual health of several indicators, such as pods and request traffic. The global health of a resource reflects the most severe health of its indicators.
Health Indicators
The table below lists the current health indicators and whether the indicator supports custom configuration for its health calculation.
| Indicator | Supports Configuration |
|---|---|
| Pod Status | No |
| Traffic Health | Yes |
Icons and colors
Kiali uses icons and colors to indicate the health of resources and associated request traffic.
-
No Health Information (NA)
-
Healthy
-
Degraded
-
Failure
Custom Request Health
There are times when Kiali’s default thresholds for traffic health do not work well for a particular situation. For example, at times 404 response codes are expected. Kiali has the ability to set powerful, fine-grained overrides for health configuration. For details, see Traffic Health Configuration.
3.4 - Istio Configuration
Kiali is more than observability, it also helps you to configure, update and validate your Istio service mesh.
The Istio configuration view provides advanced filtering and navigation for Istio configuration objects, such as Virtual Services and Gateways. Kiali provides inline config editing and powerful semantic validation for Istio resources.

Validations
Kiali performs a set of validations on your Istio Objects, such as Destination Rules, Service Entries, and Virtual Services. Kiali’s validations go above and beyond what Istio offers. Where Istio offers mainly static checks for well-formed definitions, Kiali performs semantic validations to ensure that the definitions make sense, across objects, and in some cases even across namespaces. Kiali validations are based on the runtime status of your service mesh.
Check the complete list of validations for further information.

Wizards
Kiali Wizards provide a way to apply an Istio service mesh pattern, letting Kiali generate the Istio Configuration. Wizards are launched from Kiali’s Action menus, located across the UI on relevant pages. Wizards can create and update Istio Config for Routing, Gateways, Security scenarios and more.
Istio Config Page Wizards
These Create Actions are available on the Istio Config page:

Authorization Wizards
Kiali allows creation of Istio AuthorizationPolicy resources:

Istio PeerAuthentication resources:

Istio RequestAuthentication resources:

Traffic Wizards
Kiali also allows creation of Istio Gateway resources.

Istio ServiceEntry resources:

Istio Sidecar resources:

Other Kiali Wizards
Kiali also has Wizards available from the Overview page, and many details pages, such as Service Detail to create routing rules. The Kiali Travel Tutorial goes into several of these wizards.
Overview Wizards
The Overview page has namespace-specific actions for creating traffic policies:

Service Wizards
The Service Detail page offers several wizards to create traffic control config:

3.5 - Istio Infrastructure Status
A service mesh simplifies application services by deferring the non-business logic to the mesh. But for healthy applications the service mesh infrastructure must also be running normally. Kiali monitors the multiple components that make up the service mesh, letting you know if there is an underlying problem.

A component status will be one of: Not found, Not ready, Unreachable, Not healthy and Healthy. Not found means that Kiali is not able to find the deployment. Not ready means no pods are running. Unreachable means that Kiali hasn’t been successfully able to communicate with the component (Prometheus, Grafana and Jaeger). Not healthy means that the deployment doesn’t have the desired amount of replicas running. Otherwise, the component is Healthy and it won’t be shown in the list.
Regarding the severity of each component, there are only two options: core or add-on. The core components are those shown as errors (in red) whereas the add-ons are displayed as warnings (in orange).
By default, Kiali checks that the core components “istiod”, “ingress”, and “egress” are installed and running in the control plane namespace, and that the add-ons “prometheus”, “grafana” and “jaeger” are available.
Certificate Information Indicators
In some situations, it is useful to get information about the certificates used by internal mTLS, for example:
- Know whether the default CA is used or if there is another CA configured.
- Check the certificates issuer and their validity timestamps to troubleshoot any issue with certificates.
The certificates shown depends on how Istio is configured. The following cases are possible:
- Using Istio CA certificates (default), the information shown is from a secret named istio-ca-secret.
- Using Plug in CA certificates, the information shown is from a secret named cacerts.
- Using DNS certificates, the information shown is from reading many secrets found in Istio configuration.
The following is an example of viewing the default case:

Note that displaying this configuration requires permissions to read secrets (istio-ca-secret by default, possibly cacerts or any secret configured when using DNS certificates).
Having these permissions may concern users. For this reason, this feature is implemented as a feature flag and not only can be disabled, avoiding any extra permissions to read secrets, but also a list of secrets can be configured to explicitly grant read permissions for some secrets in the control plane namespace. By default, this feature is enabled with a Kiali CR configuration equivalent to the following:
spec:
  kiali_feature_flags:
    certificates_information_indicators:
      enabled: true
      secrets:
      - cacerts
      - istio-ca-secret
You can extend this default configuration with additional secrets, remove secrets you don’t want, or disable the feature.
If you add additional secrets, the Kiali operator also needs the same privileges in order to configure Kiali successfully. If you used the Helm Charts to install the operator, specify the secretReader value with the required secrets:
$ helm install \
    --namespace kiali-operator \
    --create-namespace \
    --set "secretReader={cacerts,istio-ca-secret}"
    kiali-operator \
    kiali/kiali-operator
If you installed the operator via the OperatorHub you need to update the operator privileges as a post-installation step, as follows:
$ kubectl patch $(kubectl get clusterroles -o name | grep kiali-operator) --type "json" -p '[{"op":"add","path":"/rules/0","value":{"apiGroups":[""],"resources":["secrets"],"verbs":["get"],"resourceNames":["secret-name-to-be-read"]}}]'
Replace secret-name-to-be-read with the secret name you want the operator to read and restart the Kiali operator pod after running the previous command.
3.6 - Multi-cluster Deployment
A basic Istio mesh deployment has a single control plane with a single data plane, deployed on a single Kubernetes cluster. But Istio supports a variety of advanced deployment models. It allows a mesh to span multiple primary (control plane) and/or remote (data plane only) clusters, and can use a single or multi-network approach. The only strict rule is that within a mesh service names are unique. A non-basic mesh deployment generally involves multiple clusters. See installation instructions for more detail on installing advanced mesh deployments.
Kiali v1.29 introduces experimental support for advanced deployment models. The recommended Kiali deployment model is to deploy an instance of Kiali along with each Istio primary control plane. Each Kiali instance will work as it has in the past, with the configured Kubernetes, Prometheus and Jaeger instances. It will concern itself with the istio config managed by the local primary. But, there are two new additions:
List View: Mesh Discovery
Kiali will attempt to discover the clusters configured in the mesh. And it will identify the home cluster, meaning the cluster on which it is installed and from which it presents its traffic, traces and Istio config. In the following example there are two clusters defined in the mesh, Kukulcan and Tzotz. Kukulcan is identified as the home cluster in three places: the browser tab (not shown), the masthead, and with a star icon in the clusters list:

Graph View: Cluster and Namespace Boxing
Starting in v1.8 Istio provides cluster names in the traffic telemetry for multi-cluster installations. The Kiali graph can now use this information to better visualize clusters and namespaces. The Display menu now offers two new options: Cluster Boxes and Namespace Boxes. When enabled, either separately or together, the graph will generate boxes to help more easily identify the relevant nodes and edges, and to see traffic traveling between them.
Each new box type supports selection and will provide a side-panel summary of traffic. Below we see a Bookinfo traffic graph for when Bookinfo services are deployed across the Kukulcan and Tzotz clusters. The Kukulcan cluster box is selected. Because Kukulcan is the Kiali home cluster, you see traffic from the perspective of Kukulcan. Note that you do not see the internal traffic on Tzotz (the requests from Reviews to Ratings service). To see traffic from the Tzotz cluster point of view, you would open a Kiali session on Tzotz, assuming you have privileges.

3.7 - Security
Kiali gives support to better understand how mTLS is used in Istio meshes. Find those helpers in the graph, the masthead menu, the overview page and specific validations.
Masthead indicator
At the right side of the Masthead, Kiali shows a lock when the mesh has strictly enabled mTLS for the whole service mesh. It means that all the communications in the mesh uses mTLS.


Kiali shows a hollow lock when either the mesh is configured in PERMISSIVE mode or there is a misconfiguration in the mesh-wide mTLS configuration.
Overview locks
The overview page shows all the available namespaces with aggregated data. Besides the health and validations, Kiali shows also the mTLS status at namespace-wide. Similar to the masthead, it shows a lock when strict mTLS is enabled or a hollow lock when permissive.

Graph
The mTLS method is used to establish communication between microservices. In the graph, Kiali has the option to show which edges are using mTLS and with what percentatge during the selected period. When an edge shows a lock icon it means at least one request with mTLS enabled is present. In case there are both mTLS and non-mTLS requests, the side-panel will show the percentage of requests using mTLS.
Enable the option in the Display dropdown, select the security badge.

Validations
Kiali has different validations to help troubleshoot configurations related to mTLS such as DestinationRules and PeerAuthentications.

3.8 - Topology
Kiali offers multiple ways for users to examine their mesh Topology. Each combines several information types to help users quickly evaluate the health of their service architecture.
Overview
Kiali’s default page is the topology Overview. It presents a high-level view of the namespaces accessible to Kiali, for this user. It combines service and application information, along with telemetry, validations and health, to provide a holistic summary of system behvior. The Overview page provides numerous filtering, sorting and presentation options. From here users can perform namespace-level Actions, or quickly navigate to more detailed views.
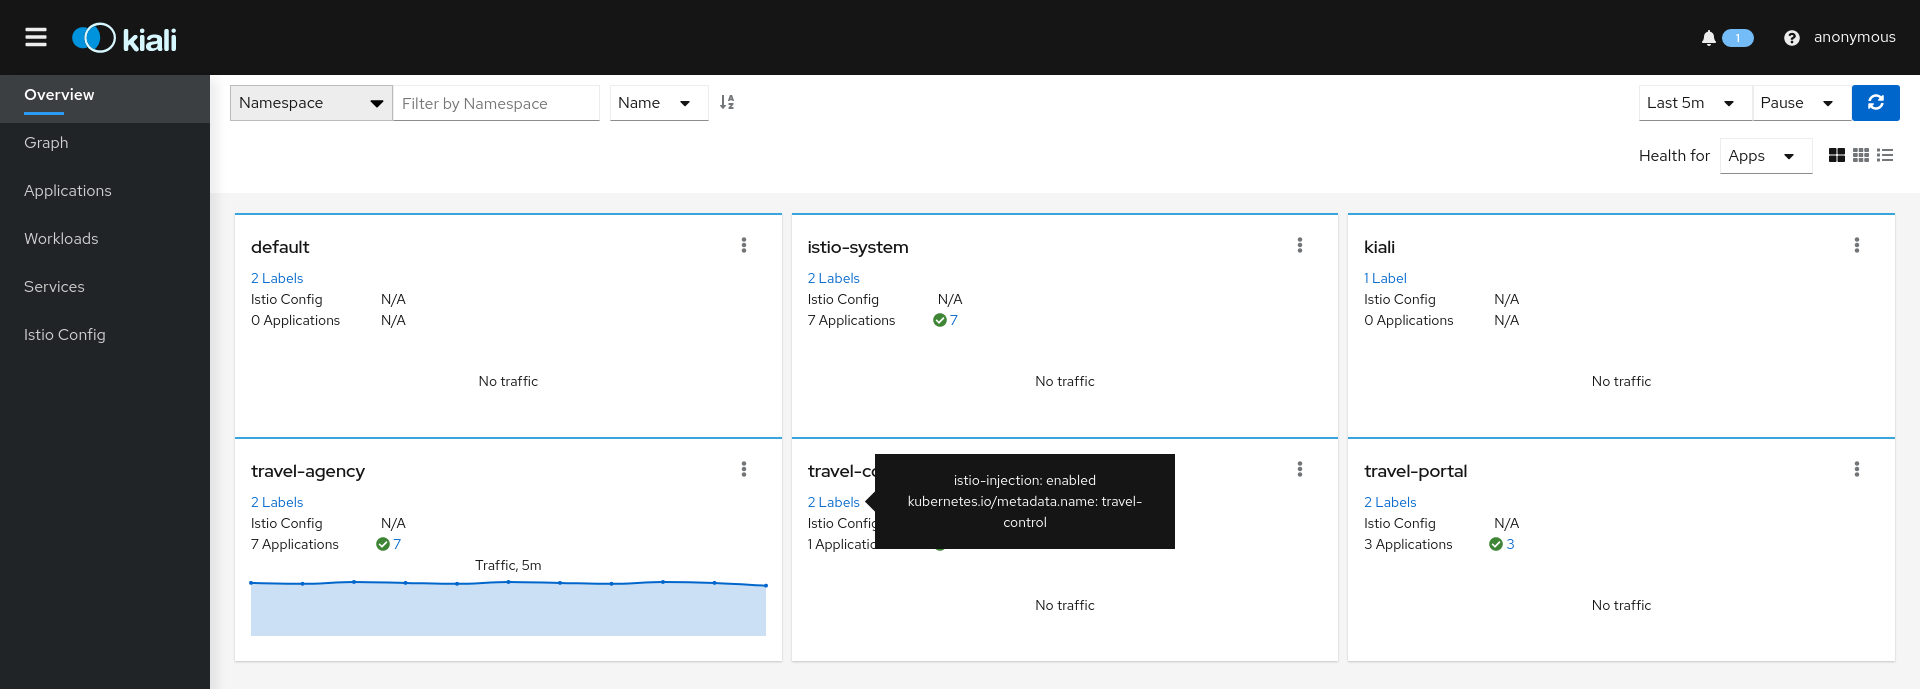
Graph
The Kiali Graph offers a powerful visualization of your mesh traffic. The topology combines real-time request traffic with your Istio configuration information to present immediate insight into the behavior of service mesh, allowing you to quickly pinpoint issues. Multiple Graph Types allow you to visualize traffic as a high-level service topology, a low-level workload topology, or as an application-level topology.
Graph nodes are decorated with a variety of information, pointing out various route routing options like virtual services and service entries, as well as special configuration like fault-injection and circuit breakers. It can identify mTLS issues, latency issues, error traffic and more. The Graph is highly configurable, can show traffic animation, and has powerful Find and Hide abilities.
You can configure the graph to show the namespaces and data that are important to you, and display it in the way that best meets your needs.
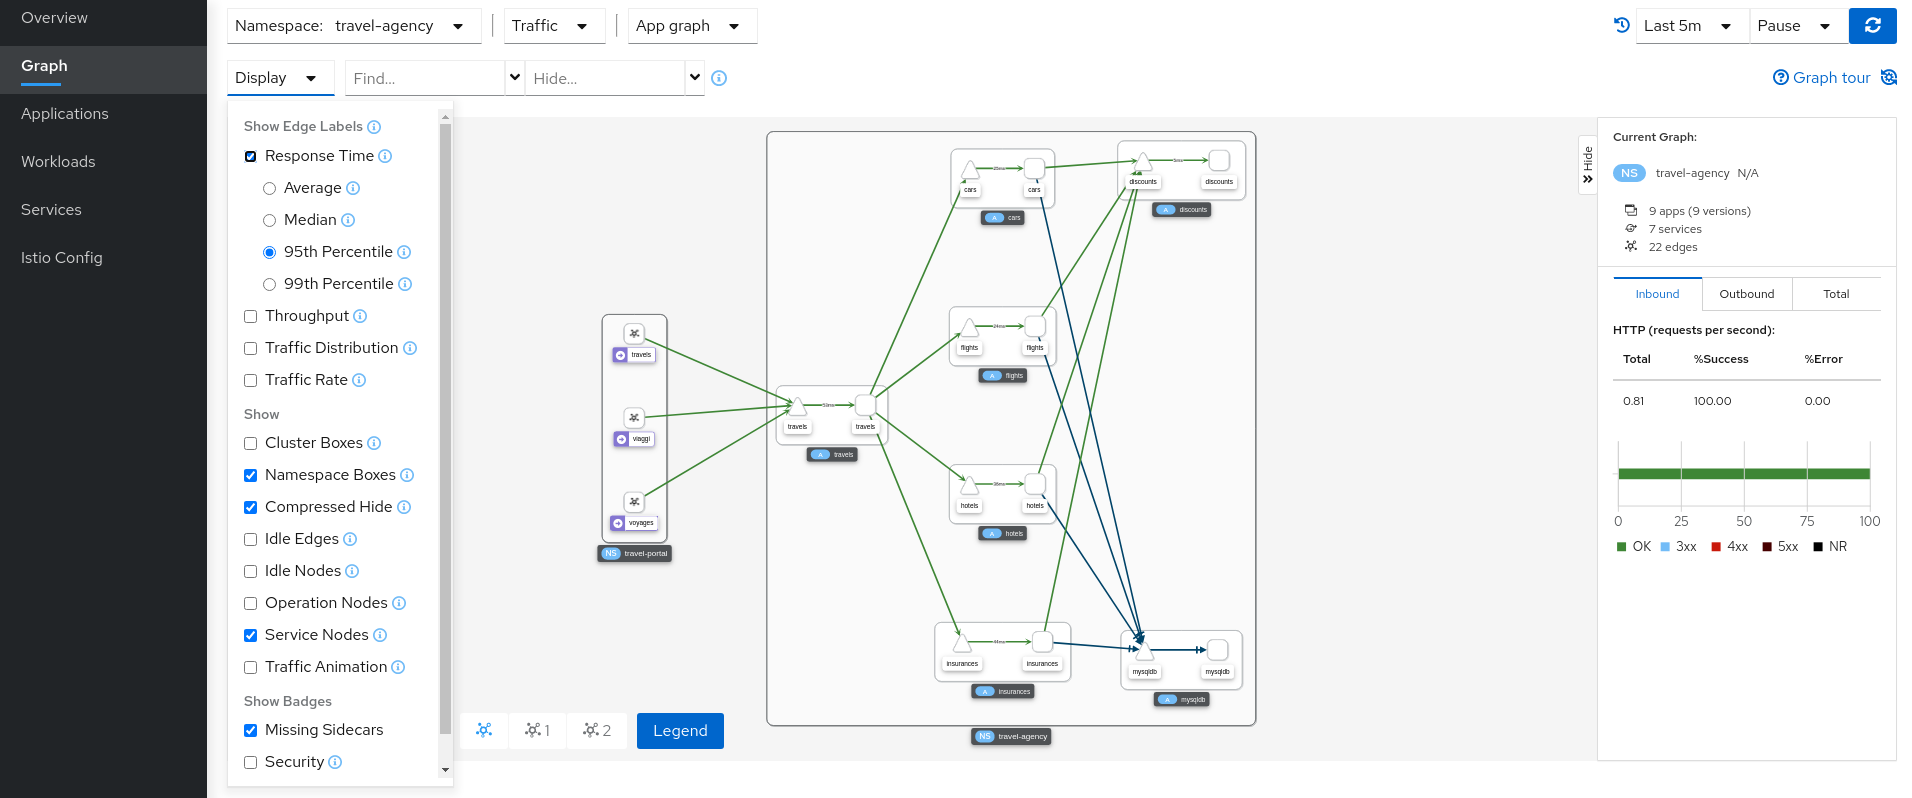
Health
Colors in the graph represent the health of your service mesh. A node colored red or orange might need attention. The color of an edge between components represents the health of the requests between those components. The node shape indicates the type of component such as services, workloads, or apps.
The health of nodes and edges is refreshed automatically based on the user’s preference. The graph can also be paused to examine a particular state, or replayed to re-examine a particular time period.
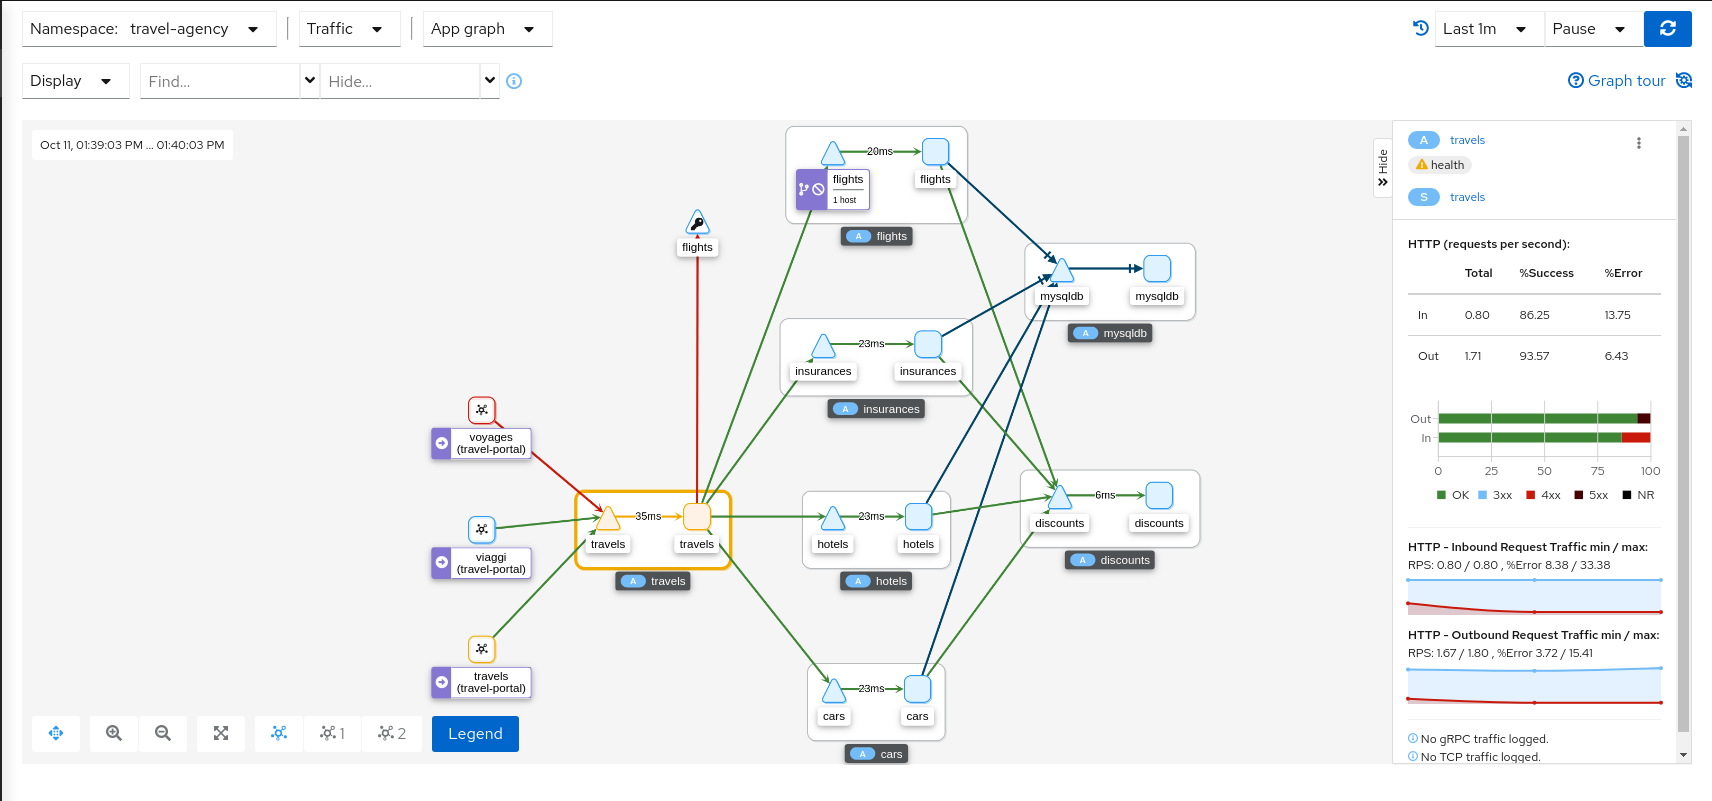
Side-Panel
The collapsible side-panel summarizes the current graph selection, or the graph as a whole. A single-click will select the node, edge, or box of interest. The side panel provides:
- Charts showing traffic and response times.
- Health details.
- Links to fully-detailed pages.
- Response Code and Host breakdowns.
- Traces involving the selected component.
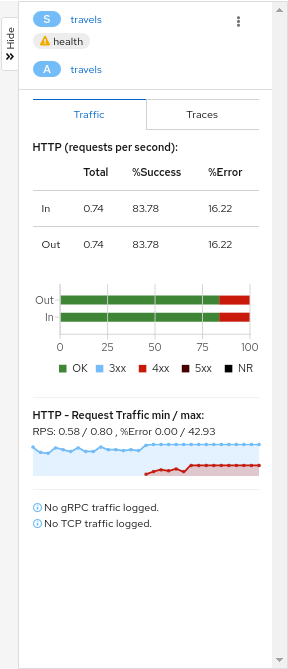
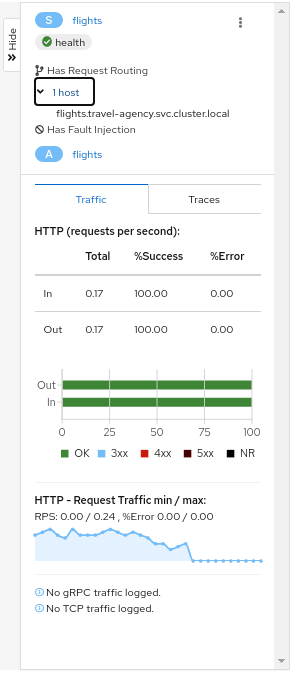
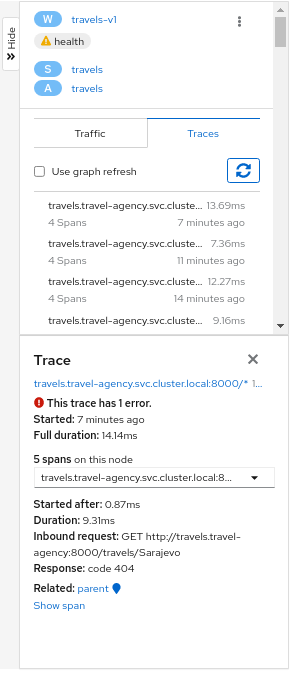
Node Detail
A single-click selects a graph node. A double-click drills in to show the node’s Detail Graph. The node detail graph visualizes traffic from the point-of-view of that node, meaning it shows only the traffic reported by that node’s Istio proxy.
You can return back to the main graph, or double-click to change to a different node’s detail graph.
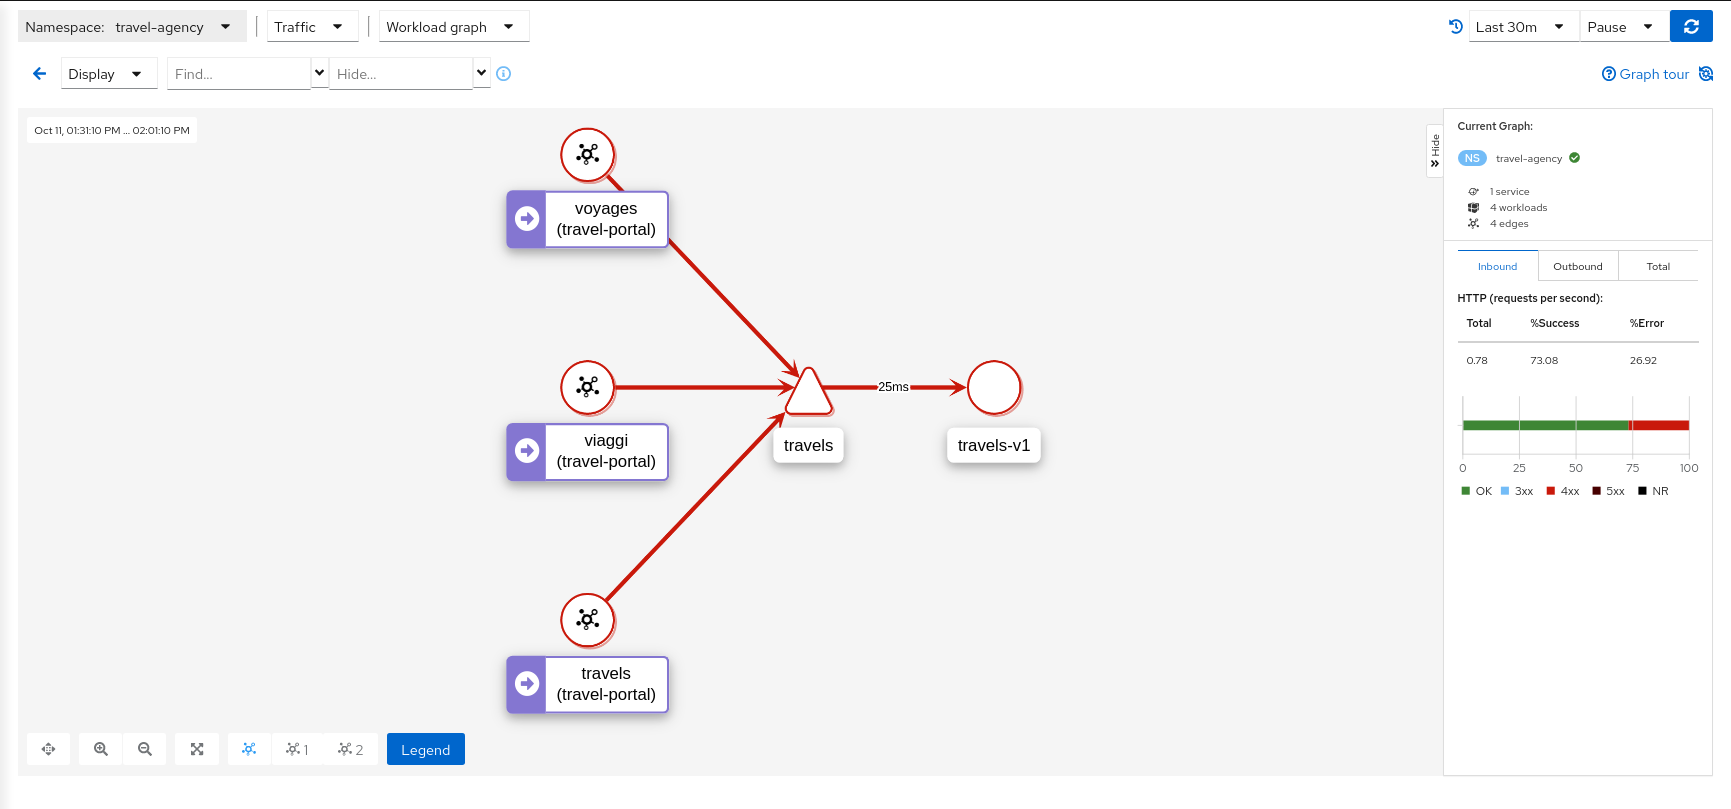
Traffic Animation
Kiali offers several display options for the graph, including traffic animation.
For HTTP traffic, circles represent successful requests while red diamonds represent errors. The more dense the circles and diamonds the higher the request rate. The faster the animation the faster the response times.
TCP traffic is represented by offset circles where the speed of the circles indicates the traffic speed.
Ranking
Nodes can be ranked in the graph based on pre-defined criteria such as ‘number of inbound edges’. Combined with the find/hide feature, this allows you to quickly highlight or filter for important workloads, services, and applications.
Rankings are normalized to fit between 1..100 and nodes may tie with each other in rank. Ranking starts at 1 for the top ranked nodes so when ranking nodes based on ‘number of inbound edges’, the node(s) with the most inbound edges would have rank 1. Node(s) with the second most inbound edges would have rank 2. Each selected criteria contributes equally to a node’s ranking. Although 100 rankings are possible, only the required number of rankings are assigned, starting at 1.
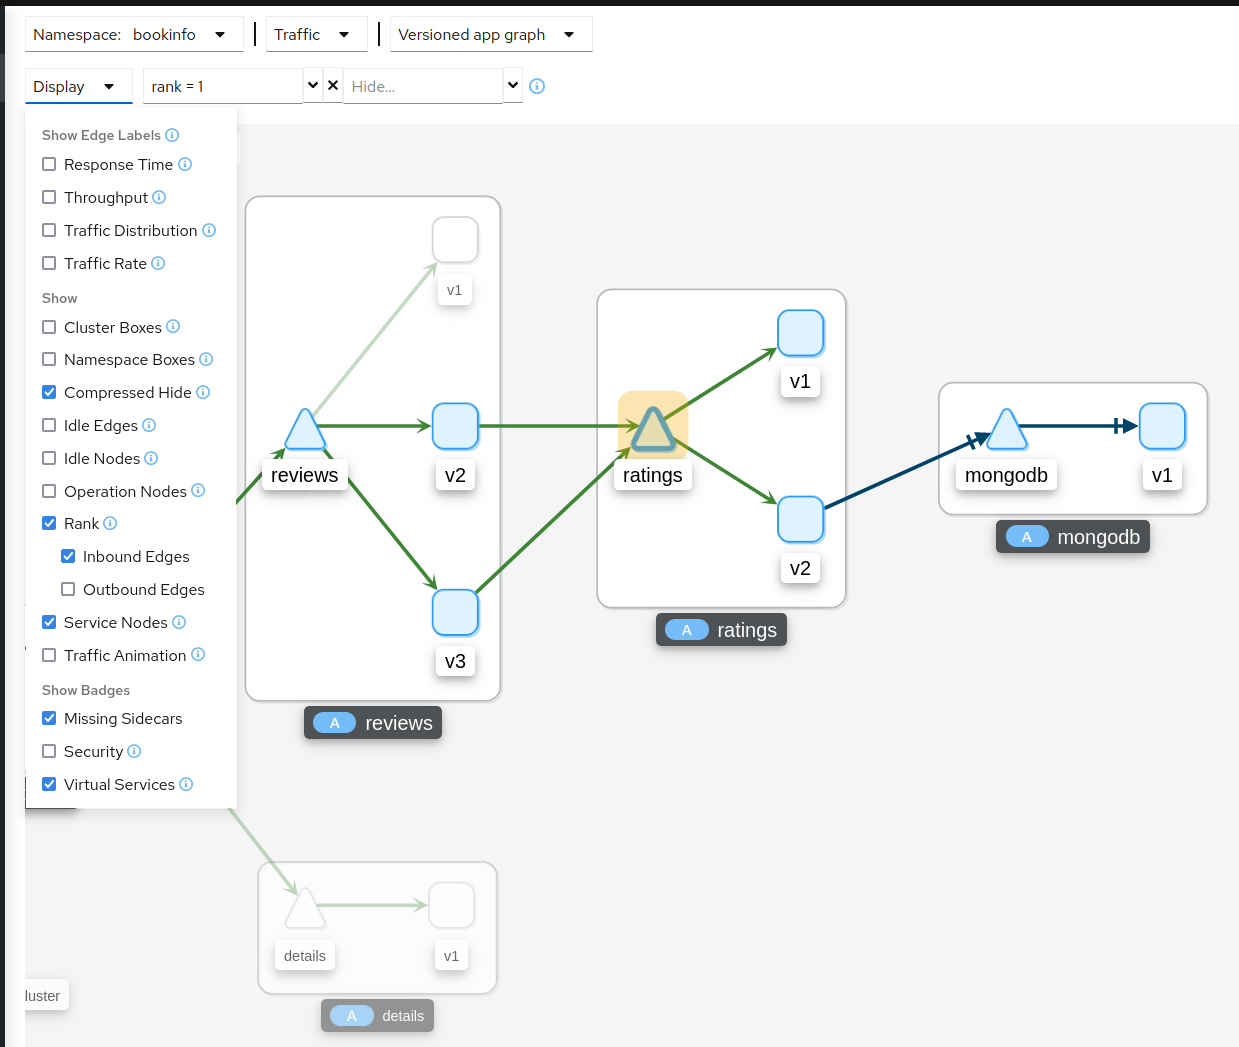
Graph Types
Kiali offers four different traffic-graph renderings:
-
The workload graph provides the a detailed view of communication between workloads.
-
The app graph aggregates the workloads with the same app labeling, which provides a more logical view.
-
The versioned app graph aggregates by app, but breaks out the different versions providing traffic breakdowns that are version-specific.
-
The service graph provides a high-level view, which aggregates all traffic for defined services.
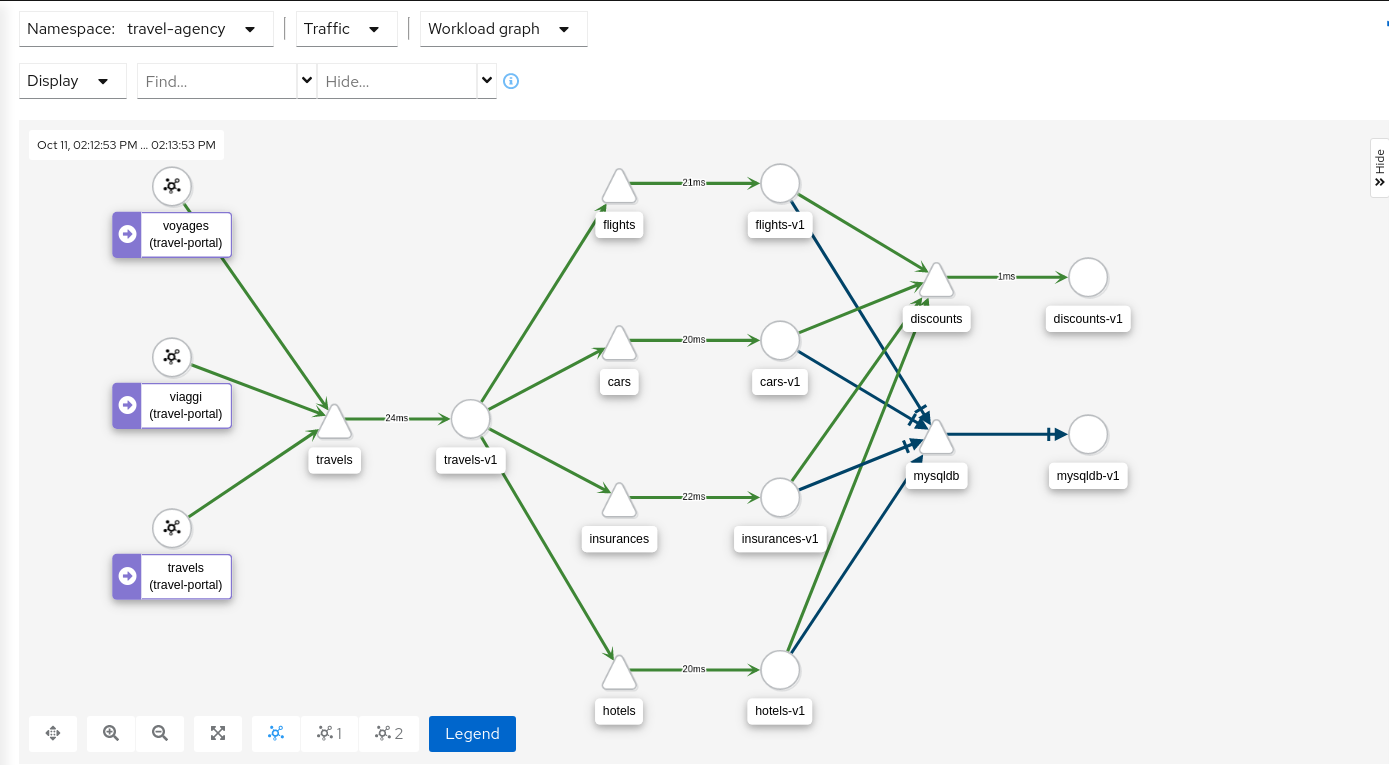
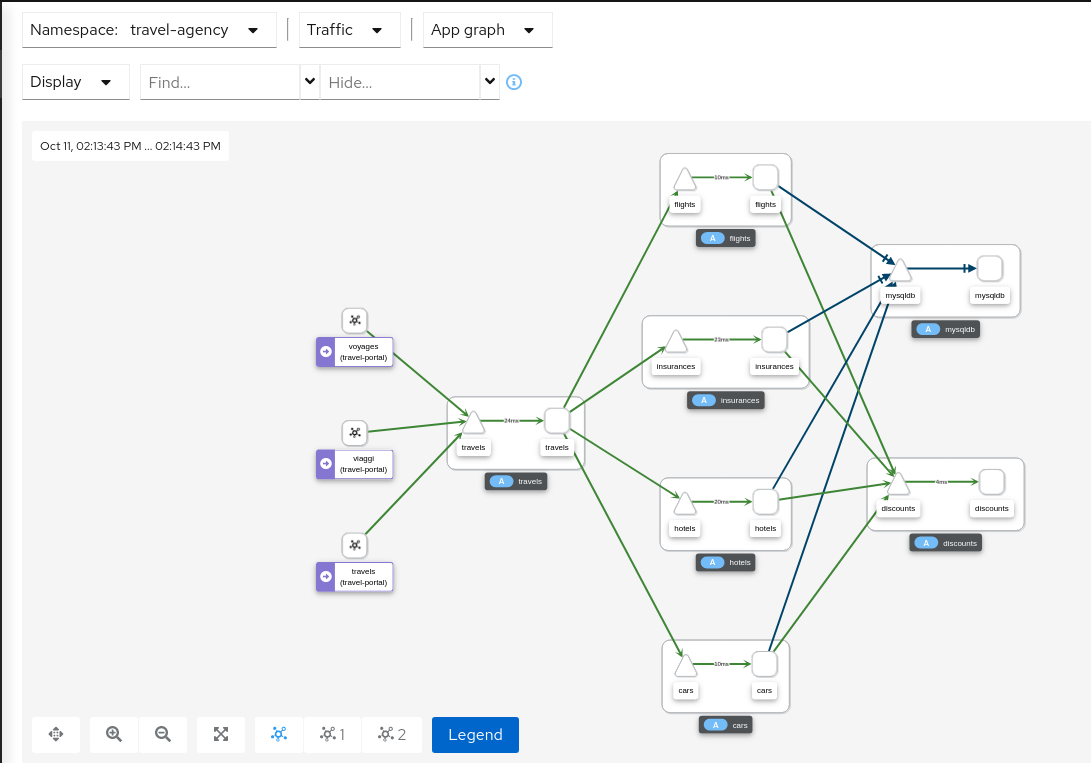
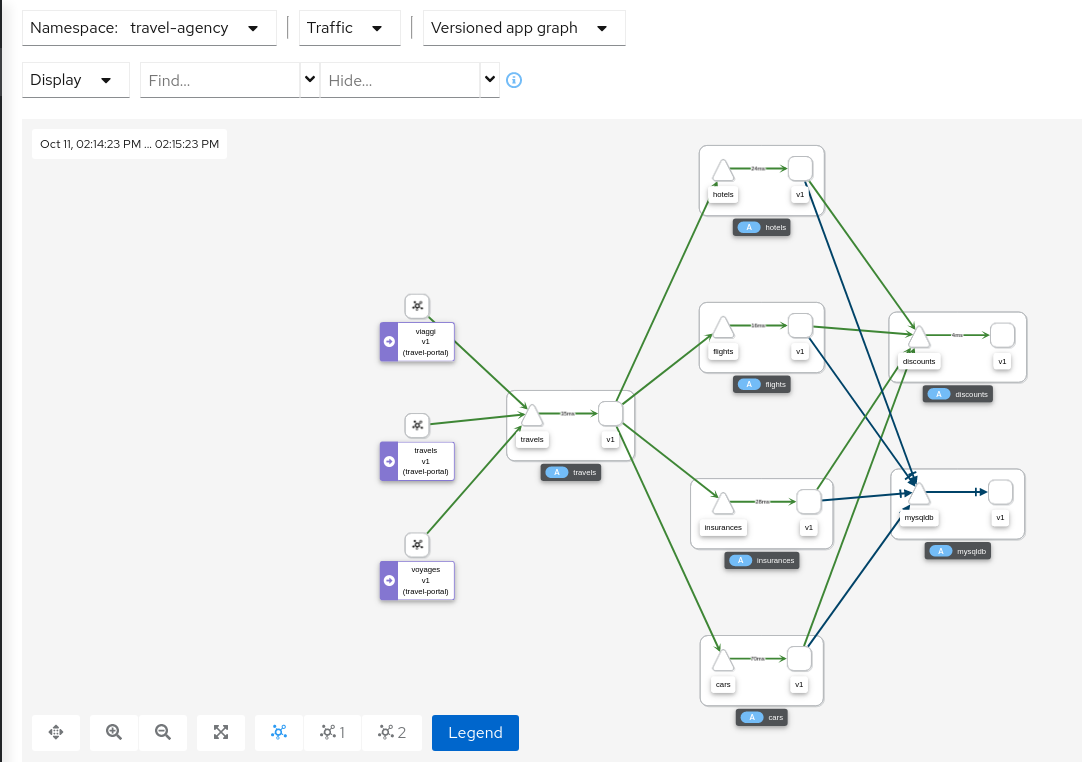
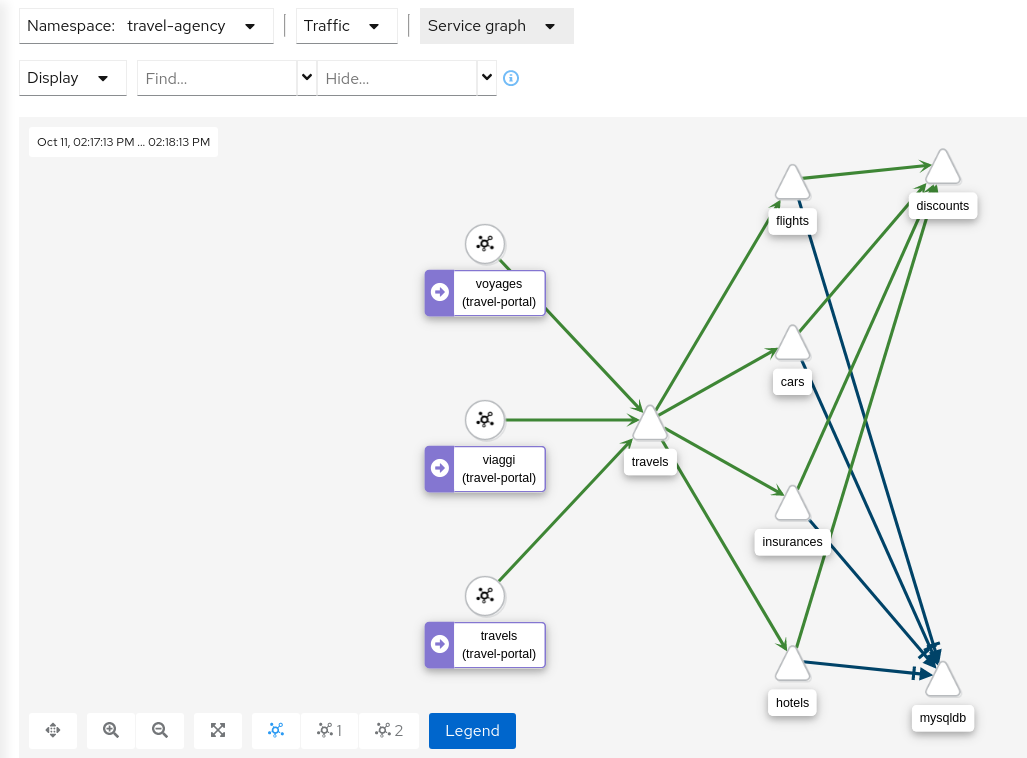
Replay
Graph replay allows you to replay traffic from a selected past time-period. This gives you a chance to thoroughly examine a time period of interest, or share it with a co-worker. The graph is fully bookmarkable, including replay.
Operation Nodes
Istio v1.6 introduced Request Classification. This powerful feature allows users to classify requests into aggregates, called “Operations” by convention, to better understand how a service is being used. If configured in Istio the Kiali graph can show these as Operation nodes. The user needs only to enable the “Operation Nodes” display option. Operations can span services, for example, “VIP” may be configured for both CarRental and HotelRental services. To see total “VIP” traffic then display operation nodes without service nodes. To see “VIP” traffic specific to each service then also enable the “Service Nodes” display option.
When selected, an Operation node also provides a side-panel view. And when double-clicked a node detail graph is also provided.
Because operation nodes represent aggregate traffic they are not compatible with Service graphs, which themselves are already logical aggregates. For similar reasons response time information is not available on edges leading into or out of operation nodes. But by selecting the edge the response time information is available in the side panel (if configured).
Operation nodes are represented as pentagons in the Kiali graph:
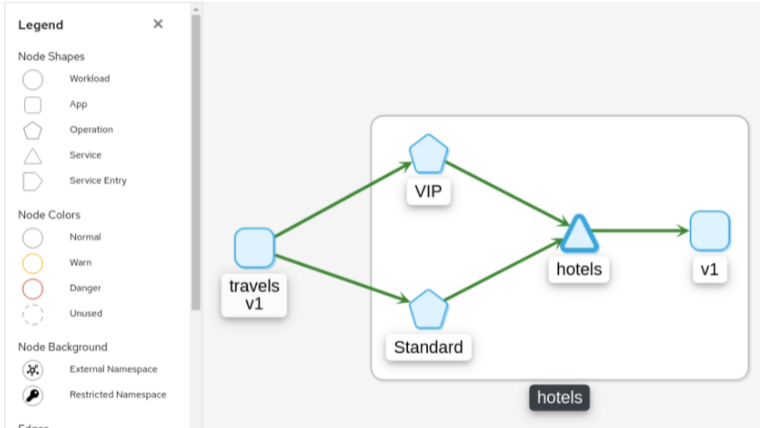
3.9 - Tracing
Kiali offers a native integration with Jaeger for Distributed Tracing. As such, users can access Jaeger’s trace visualizations. But more than that, Kiali incorporates tracing into several correlated views, making your investment in trace data even more valuable.
For a quick glimpse at Kiali tracing features, see below. For a detailed explanation of tracing in Kiali, see this 3-part Trace my mesh blog series,
Workload detail
When investigating a workload, click the Traces tab to visualize your traces in a chart. When selecting a trace Kiali presents a tab for trace detail, and a tab for span details. Kiali always tries to surface problem areas, Kiali uses a heatmap approach to help the user identify problem traces or spans.
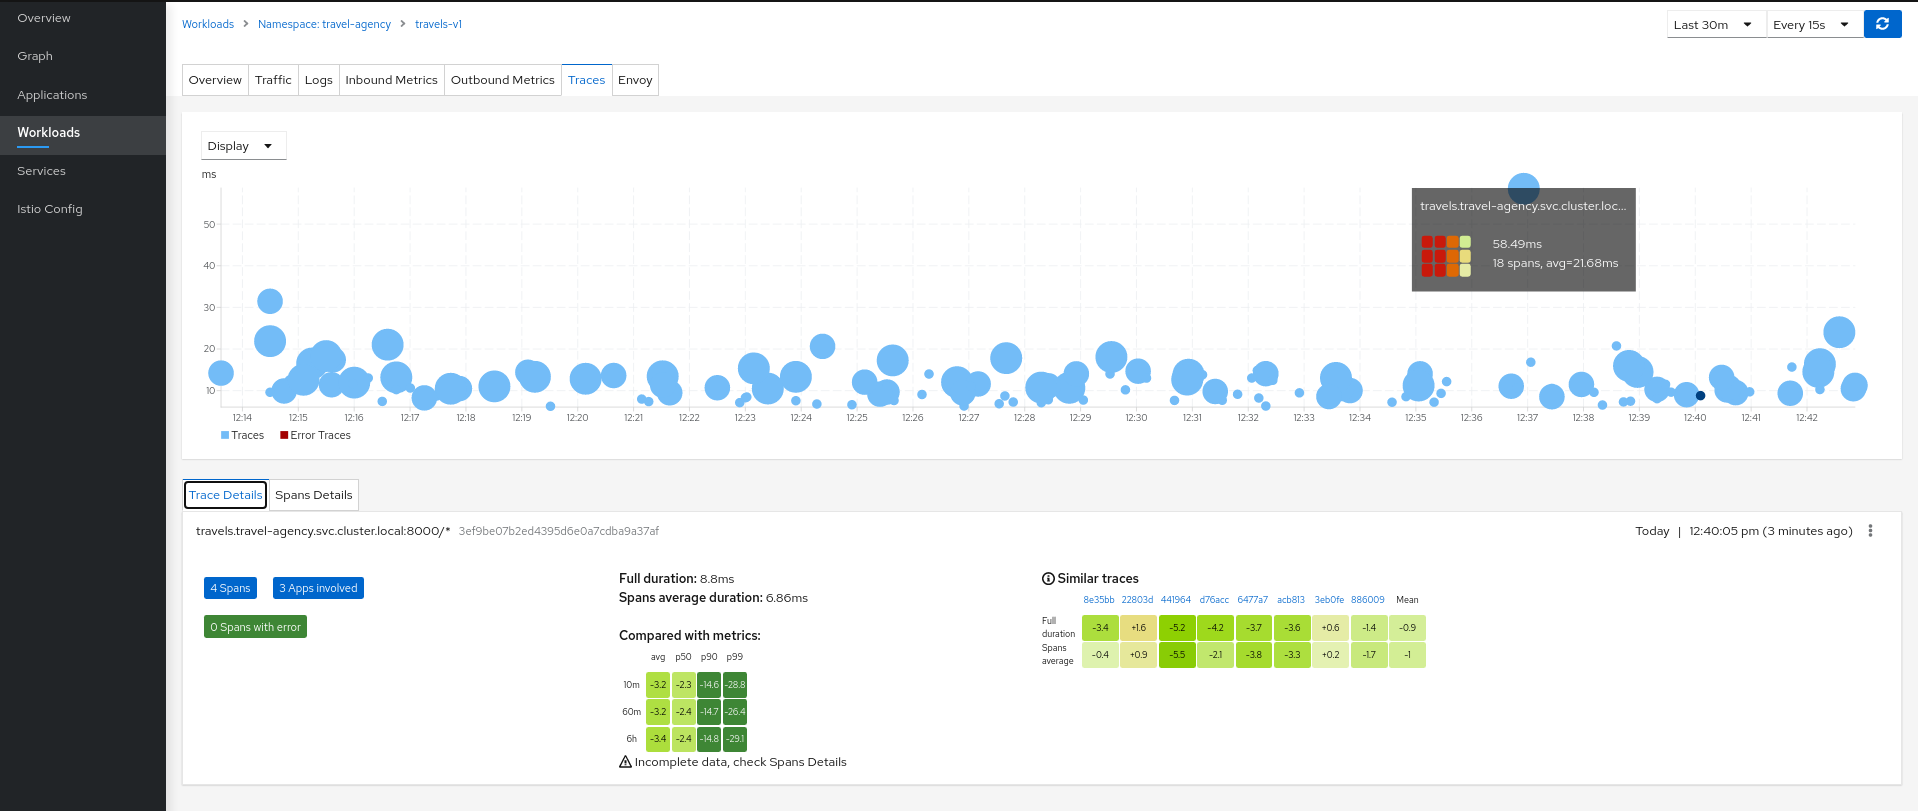
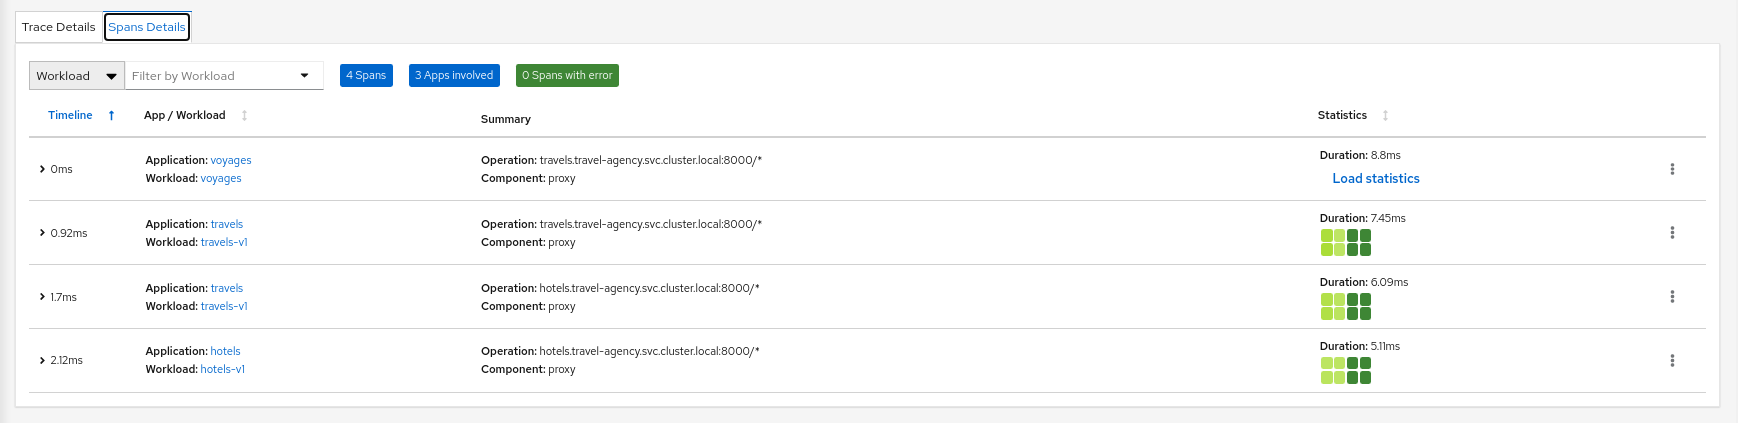
Heatmaps
A heatmap that you see in the Workload’s Tracing tab is a matrix that compares a specific trace’s request duration against duration metrics aggregated over time.

Each trace has a corresponding heatmap matrix. Each cell in the matrix corresponds to a specific metric aggregate; the value and color of a cell represents the difference between that metric and the duration of the matrix’s associated trace.
For example, the top-right cell of the heatmap above shows that the duration of the request represented by the trace (5.96ms) was 17.5ms faster than the 99th percentile of all inbound requests to the workload within the last 10 minutes.
The color of a cell will range between red and green; the more green a cell is, the faster the duration of the trace was compared to the aggregate metric data. A red cell indicates the associated trace was much slower compared to the aggregate metric data and so examining that trace could help detect a potential bottleneck or problem.
Metric Correlation
Kiali offers span overlays on Metric charts. The user can simply enable the spans option to generate the overlay. Clicking any
span will navigate back to the Traces tab, focused on the trace of interest.
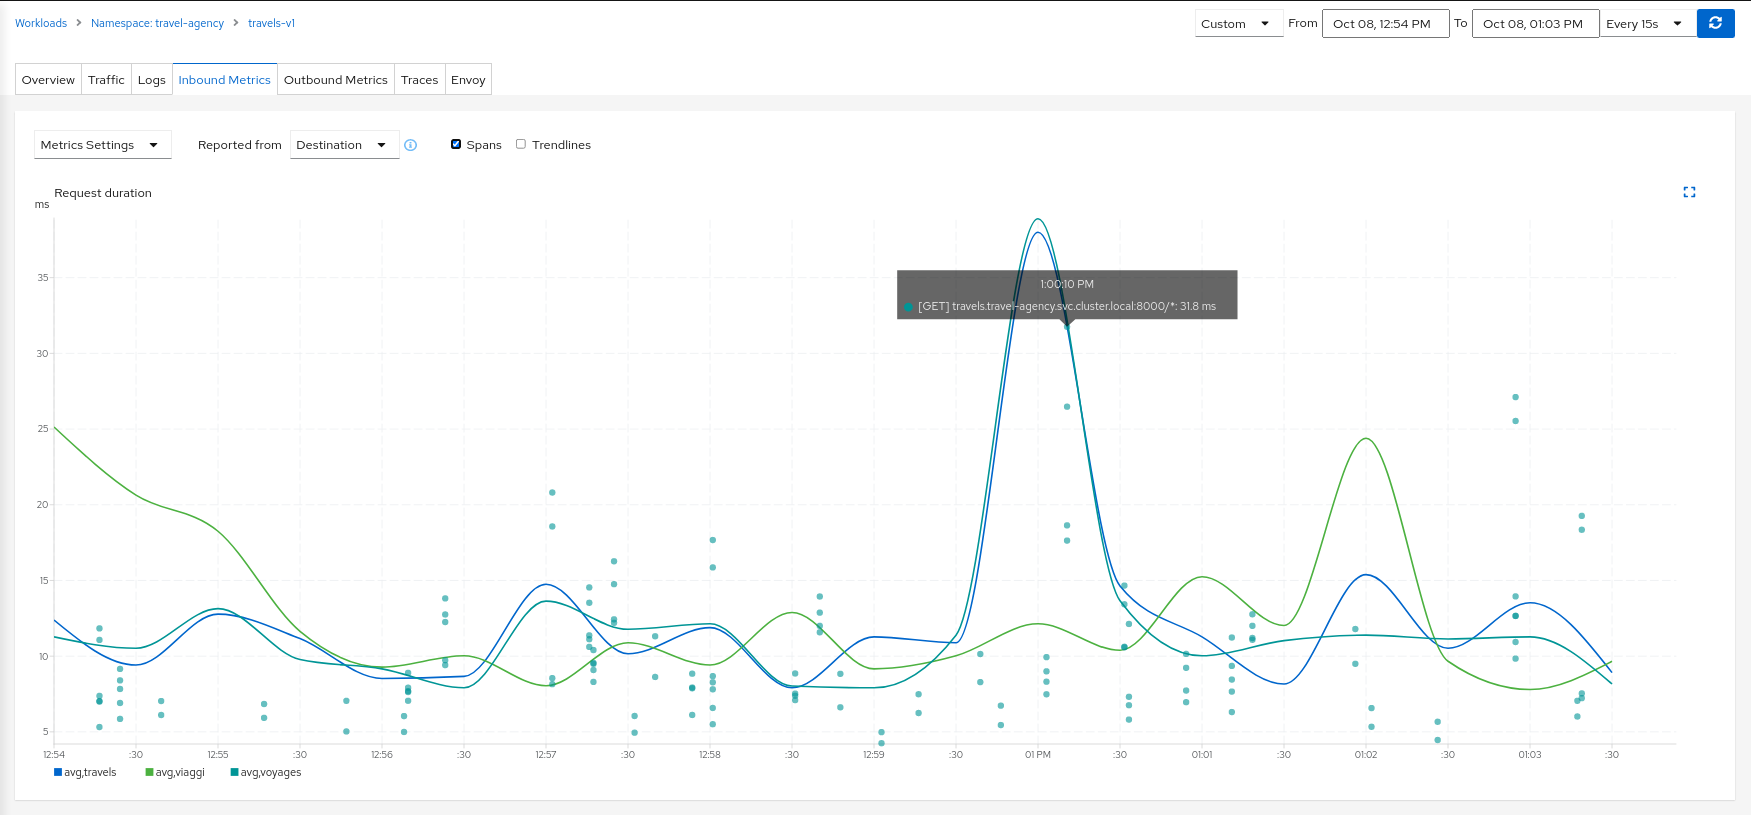
Graph Correlation
Kiali users often use the Graph Feature to visualize their mesh traffic. In the side panel, When selecting a graph node, the user will be presented with a Traces tab, which lists available traces for the time period. When selecting a trace the graph will display an overlay for the trace’s spans. And the side panel will display span details and offer links back to the trace detail views.
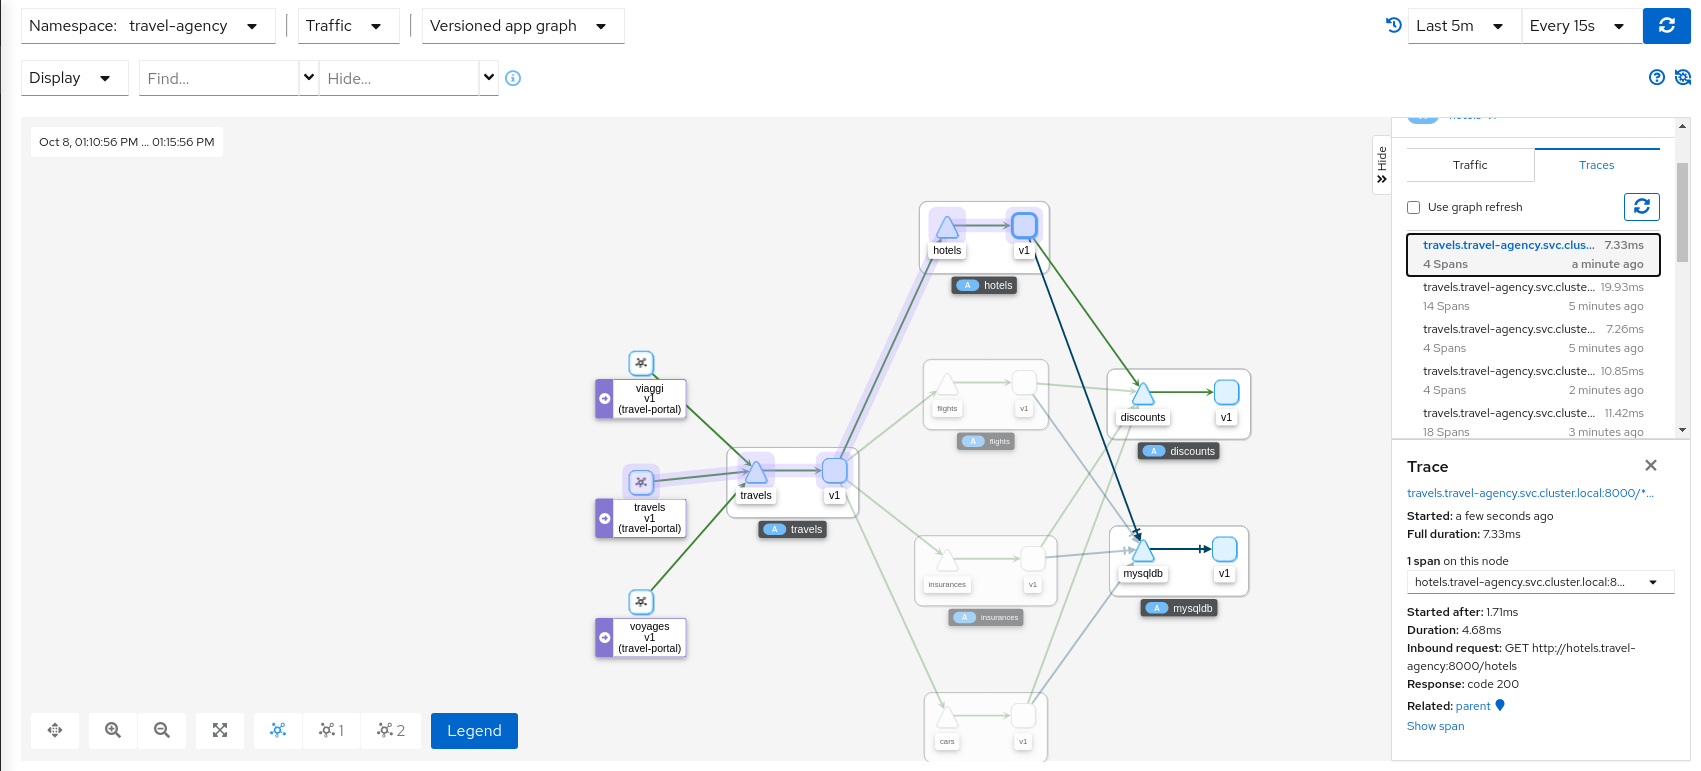
Logs Correlation
Kiali works to correlate the standard pillars of observability: traces, metrics and logs. Kiali can present a unified view of
log and trace information, in this way letting users use logs to identify traces of interest. When enabling the spans option
Kiali adds trace entries to the workload logs view. Below, in time-sorted order, the user is presented with a unified view of application
logs (in white), Envoy proxy logs (in gold), and trace spaces (in blue). Clicking a span of interest brings you to the detail
view for the trace of interest.
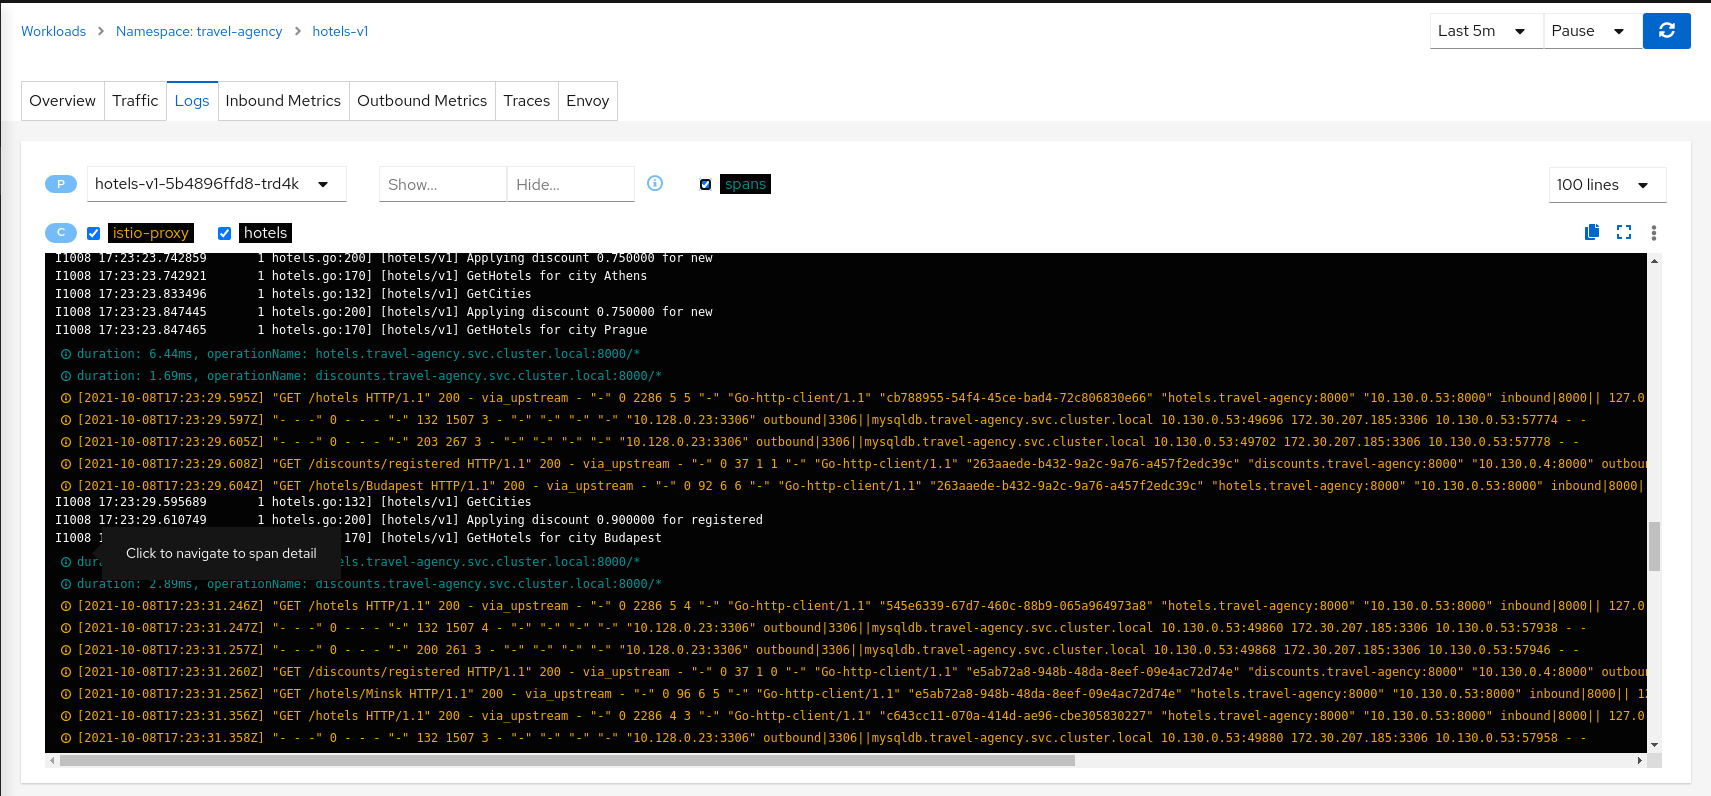
3.10 - Validation
Kiali performs a set of validations on your Istio Objects, such as Destination Rules, Service Entries, and Virtual Services. Kiali’s validations go above and beyond what Istio offers. Where Istio offers mainly static checks for well-formed definitions, Kiali performs semantic validations to ensure that the definitions make sense, across objects, and in some cases even across namespaces. Kiali validations are based on the runtime status of your service mesh.
The complete list of validations:
AuthorizationPolicy
KIA0101 - Namespace not found for this rule
AuthorizationPolicy enables access control on workloads. Each policy effects only to a group of request. For instance, all requests started from a workload on a list of namespaces. The present validation points out those rules referencing a namespace that don’t exist in the cluster.
Resolution
Either remove the namespace from the list, correct if there is any typo or create a new namespace.
Severity
Warning
Example
apiVersion: security.istio.io/v1beta1
kind: AuthorizationPolicy
metadata:
 name: httpbin
 namespace: default
spec:
 selector:
   matchLabels:
     app: httpbin
     version: v1
 rules:
 - from:
   - source:
       principals: ["cluster.local/ns/default/sa/sleep"]
   - source:
       namespaces:
         - default
         - non-existing # warning
         - unexisting # warning
   to:
   - operation:
       methods: ["GET"]
       paths: ["/info*"]
   - operation:
       methods: ["POST"]
       paths: ["/data"]
   when:
   - key: request.auth.claims[iss]
     values: ["https://accounts.google.com"]
See Also
KIA0102 - Only HTTP methods and fully-qualified gRPC names are allowed
An AuthorizationPolicy has an Operation field where is defined the oprations allowed for a request. In the method field are listed all the allowed methods that request can have. This validation appears when a problem is found in there. The only methods accepted are: either HTTP valid methods or fully-qualified names of gRPC service in the form of “/package.service/method”
Resolution
Either change or remove the violating method. It has to be either a HTTP valid method or a fully-qualified names of a gRPC service in the form of “/package.service/method”
Severity
Warning
Example
apiVersion: security.istio.io/v1beta1
kind: AuthorizationPolicy
metadata:
 name: httpbin
 namespace: default
spec:
 selector:
   matchLabels:
     app: httpbin
     version: v1
 rules:
 - from:
   - source:
       principals: ["cluster.local/ns/default/sa/sleep"]
   - source:
       namespaces:
         - default
   to:
   - operation:
       methods:
         - "GET"
         - "/package.service/method"
         - "WRONG" # Warning
         - "non-fully-qualified-grpc" # Warning
       paths: ["/info*"]
   - operation:
       methods: ["POST"]
       paths: ["/data"]
   when:
   - key: request.auth.claims[iss]
     values: ["https://accounts.google.com"]
See Also
KIA0104 - This host has no matching entry in the service registry
AuthorizationPolicy enables access control on workloads. Each policy effects only to a group of request going to a specific destination. For instance, allow all the request going to details host.
The present validation points out those rules referencing a host that don’t exist in the authorization policy namespace. Kiali considers services and service entries. Those hosts that refers to hosts outside of the object namespace will be presented with an unknow error.
Resolution
Either remove the host from the list, correct if there is any typo or deploy a new service or service entry.
Severity
Error
Example
apiVersion: security.istio.io/v1beta1
kind: AuthorizationPolicy
metadata:
 name: httpbin
 namespace: default
spec:
 selector:
   matchLabels:
     app: httpbin
     version: v1
 rules:
 - from:
   - source:
       principals: ["cluster.local/ns/default/sa/sleep"]
   - source:
       namespaces:
         - default
   to:
   - operation:
       hosts:
         - wrong # Error
         - ratings
         - details.default
         - reviews.default.svc.cluster.local
         - productpage.outside # Unknown
         - google.com # Service Entry present. No error
         - google.org # Service Entry not present, wrong domain. Error.
       methods:
         - "GET"
         - "/package.service/method"
       paths: ["/info*"]
   - operation:
       methods: ["POST"]
       paths: ["/data"]
   when:
   - key: request.auth.claims[iss]
     values: ["https://accounts.google.com"]
See Also
- Validator source code
- AuthorizationPolicy documentation
- Definition of the operations field
- Service association requirement
KIA0105 - This field requires mTLS to be enabled
AuthorizationPolicy has a Source field, where specifies the source identities of a request. In a Source field it accepts the principals and the namespaces, which requires mTLS enabled.
A validation Error message on a principals or namespaces fields means, that mTLS is not enabled.
This validation appears only when autoMtls is disabled.
Resolution
Either remove this field or enable autoMtls.
Severity
Error
Example
apiVersion: security.istio.io/v1beta1
kind: AuthorizationPolicy
metadata:
 name: httpbin
 namespace: bookinfo
spec:
 selector:
   matchLabels:
     app: httpbin
     version: v1
 rules:
 - from:
   - source:
       principals: ["cluster.local/ns/default/sa/sleep"]
   - source:
       namespaces:
         - default
   to:
   - operation:
       methods: ["GET"]
       paths: ["/info*"]
   - operation:
       methods: ["POST"]
       paths: ["/data"]
   when:
   - key: request.auth.claims[iss]
     values: ["https://accounts.google.com"]
See Also
- AuthorizationPolicy documentation
- Definition of the Source field
- Service association requirement
- Globally enabling Istio mutual TLS
KIA0106 - Service Account not found for this principal
AuthorizationPolicy has a Source field, where specifies the source identities of a request.
In a Source field it accepts the principals, a list of peer identities derived from the peer certificate. The peer identity is in the format of <TRUST_DOMAIN>/ns/<NAMESPACE>/sa/<SERVICE_ACCOUNT>, for example, cluster.local/ns/default/sa/productpage.
A validation Error message on a principal value means, that the specified Service Account was not found in a given Namespace.
Resolution
Correct the principal to refer to existing Service Account, make sure that the value is in correct format without a typo.
Severity
Error
Example
apiVersion: security.istio.io/v1beta1
kind: AuthorizationPolicy
metadata:
 name: httpbin
 namespace: default
spec:
 selector:
   matchLabels:
     app: httpbin
     version: v1
 rules:
 - from:
   - source:
       principals: ["cluster.local/ns/default/sa/sleep"]
   - source:
       namespaces:
         - default
   to:
   - operation:
       hosts:
         - ratings
         - details.default
         - reviews.default.svc.cluster.local
       methods:
         - "GET"
       paths: ["/info*"]
   - operation:
       methods: ["POST"]
   when:
   - key: request.auth.claims[iss]
     values: ["https://accounts.google.com"]
See Also
Destination rules
KIA0201 - More than one DestinationRules for the same host subset combination
Istio applies traffic rules for services after the routing has happened. These can include different settings such as connection pooling, circuit breakers, load balancing, and detection. Istio can define the same rules for all services under a host or different rules for different versions of the service.
This validation warning could be a result of duplicate definition of the same subsets as well as from rules that apply to all subsets. Also, a combination of one Destination Rule (DR) applying to all subsets and another defining behavior for only some subsets triggers this validation warning.
Istio silently ignores the duplicate subsets and merge these destination rules without letting the user know. Only the first seen rule (by Istio) per subset is used and information from multiple definitions is not merged. While the routing might work correctly, this is most likely a configuration error. It may lead to a undesired behavior if one of the offending rules is removed or modified and that is probably not the intention of the deployer of this service. Also, if the two offending destination rules have different policies for traffic routing the wrong one might be used.
Resolution
Either merge the settings to a single DR or split the subsets in such a way that they do not interleave. This ensures that the routing behavior stays consistent.
Severity
Warning
Example
apiVersion: networking.istio.io/v1alpha3
kind: DestinationRule
metadata:
  name: reviews-dr1
spec:
  host: reviews
  trafficPolicy:
    loadBalancer:
      simple: RANDOM
  subsets:
  - name: v1
    labels:
      version: v1
  - name: v2
    labels:
      version: v2
  - name: v3
    labels:
      version: v3
---
apiVersion: networking.istio.io/v1alpha3
kind: DestinationRule
metadata:
  name: reviews-dr2
spec:
  host: reviews
  trafficPolicy:
    loadBalancer:
      simple: RANDOM
  subsets:
  - name: v1
    labels:
      version: v1
See Also
- Validator source code
- Destination rule documentation
- Istio source code for merging
- Istio documentation: Split large virtual services and destination rules into multiple resources
KIA0202 - This host has no matching entry in the service registry (service, workload or service entries)
Istio applies traffic rules for services after the routing has happened. These can include different settings such as connection pooling, circuit breakers, load balancing, and detection. Istio can define the same rules for all services under a host or different rules for different versions of the service. The host must a service that is defined in the platform’s service registry or as a ServiceEntry. Short names are extended to include ‘.namespace.cluster’ using the namespace of the destination rule, not the service itself. FQDN is evaluated as is. It is recommended to use the FQDN to prevent any confusion.
If the host is not found, Istio ignores the defined rules.
Resolution
Correct the host to point to a correct service, in this namespace or with FQDN to other namespaces, or deploy the missing service to the mesh.
Severity
Error
Example
apiVersion: networking.istio.io/v1alpha3
kind: DestinationRule
metadata:
  name: reviews
spec:
  host: notpresent
  trafficPolicy:
    loadBalancer:
      simple: RANDOM
  subsets:
  - name: v1
    labels:
      version: v1
  - name: v2
    labels:
      version: v2
  - name: v3
    labels:
      version: v3
See Also
KIA0203 - This subset’s labels are not found in any matching host
Istio applies traffic rules for services after the routing has happened. These can include different settings such as connection pooling, circuit breakers, load balancing, and detection. Istio can define the same rules for all services under a host or different rules for different versions of the service. The host must a service that is defined in the platform’s service registry or as a ServiceEntry. Short names are extended to include ‘.namespace.cluster’ using the namespace of the destination rule, not the service itself. FQDN is evaluated as is. It is recommended to use the FQDN to prevent any confusion.
Subsets can override the global settings defined in the DR for a host.
If the host is not found, Istio ignores the defined rules.
If the not found subset is not referenced in any Virtual Service, the severity of this error is changed to Info.
Resolution
Correct the host to point to a correct service, in this namespace or with FQDN to other namespaces, or deploy the missing service to the mesh. If the hostname is equal to the one used otherwise in the DR, consider removing the duplicate host resolution.
Also, verify that the labels are correctly matching a workload with the intended service.
Severity
Error
Example
apiVersion: networking.istio.io/v1alpha3
kind: DestinationRule
metadata:
  name: reviews
spec:
  host: reviews
  trafficPolicy:
    loadBalancer:
      simple: RANDOM
  subsets:
  - name: v1
    labels:
      version: v10
  - name: v2
    labels:
      notfoundlabel: v2
  - name: v3
    labels:
      version: v3
See Also
KIA0204 - mTLS settings of a non-local Destination Rule are overridden
Istio allows you to define DestinationRule at three different levels: mesh, namespace and service level. A mesh may have multiple DRs. In case of having two DestinationRules on the first one is at a lower level than the second one, the first one overrides the TLS values of the second one.
This validation appears only when autoMtls is disabled.
Resolution
This validation aims to warn Kiali users that they may be disabling/enabling mTLS from the higher DestinationRule. Merging the TLS settings to one of the DestinationRules is the only way to fix this validation. However, this is a valid scenario so it might be impossible to remove this warning.
Severity
Warning
Example
apiVersion: "networking.istio.io/v1alpha3"
kind: "DestinationRule"
metadata:
  name: "default"
  namespace: "istio-system"
spec:
  host: "*.local"
  trafficPolicy:
    tls:
      mode: ISTIO_MUTUAL
---
apiVersion: networking.istio.io/v1alpha3
kind: DestinationRule
metadata:
  name: reviews
spec:
  host: reviews
  trafficPolicy:
    loadBalancer:
      simple: RANDOM
  subsets:
  - name: v1
    labels:
      version: v1
  - name: v2
    labels:
      version: v2
  - name: v3
    labels:
      version: v3
See Also
KIA0205 - PeerAuthentication enabling mTLS at mesh level is missing
Istio has the ability to define mTLS communications at mesh level. In order to do that, Istio needs one DestinationRule and one PeerAuthentication. The DestinationRule configures all the clients of the mesh to use mTLS protocol on their connections. The PeerAuthentication defines what authentication methods that can be accepted on the workload of the whole mesh. If the PeerAuthentication is not found or doesn’t exist and the mesh-wide DestinationRule is on ISTIO_MUTUAL mode, all the communication returns 500 errors.
This validation appears only when autoMtls is disabled.
Resolution
Add a PeerAuthentication within the istio-system namespace without specifying targets but setting peers mtls mode to STRICT or PERMISSIVE. The PeerAuthentication should be like this.
Severity
Error
Example
# AutoMtls disabled, no PeerAuthentication at mesh-level defined
apiVersion: "networking.istio.io/v1alpha3"
kind: "DestinationRule"
metadata:
  name: "default"
  namespace: "istio-system"
spec:
  host: "*.local"
  trafficPolicy:
    tls:
      mode: ISTIO_MUTUAL
See Also
KIA0206 - PeerAuthentication enabling namespace-wide mTLS is missing
Istio has the ability to define mTLS communications at namespace level. In order to do that, Istio needs both a DestinationRule and a PeerAuthentication targeting all the clients/workloads of the specific namespace. The PeerAuthentication allows mTLS authentication method for all the workloads within a namespace. The DestinationRule defines all the clients within the namespace to start communications in mTLS mode. If the PeerAuthentication is not found and the DestinationRule is on STRICT mode in that namespace but there is the DestinationRule enabling mTLS, all the communications within that namespace returns 500 errors.
This validation appears only when autoMtls is disabled.
Resolution
A PeerAuthentication enabling mTLS method is needed for the workloads in the namespace. Otherwise all the clients start mTLS connections that those workloads won’t be ready to manage. Add a PeerAuthentication without specifying targets but setting mTLS mode to STRICT or PERMISSIVE in the same namespace as the DestinationRule.
Severity
Error
Example
apiVersion: "networking.istio.io/v1alpha3"
kind: "DestinationRule"
metadata:
  name: "enable-mtls"
  namespace: "bookinfo"
spec:
  host: "*.bookinfo.svc.cluster.local"
  trafficPolicy:
    tls:
      mode: ISTIO_MUTUAL
See Also
KIA0207 - PeerAuthentication with TLS strict mode found, it should be permissive
Istio needs both a DestinationRule and PeerAuthentication to enable mTLS communications. The PeerAuthentication configures the authentication method accepted for all the targeted workloads. The DestinationRule defines which is the authentication method that the clients of specific workloads has to start communications with.
Resolution
Kiali has found that there is a DestinationRule sending traffic without mTLS authentication method. There are two different ways to fix this situation. You can either change the PeerAuthentication applying to PERMISSIVE mode or change the DestinationRule to start communications using mTLS.
Severity
Error
Example
apiVersion: "networking.istio.io/v1alpha3"
kind: "DestinationRule"
metadata:
  name: "disable-mtls"
  namespace: "bookinfo"
spec:
  host: "*.bookinfo.svc.cluster.local"
  trafficPolicy:
    tls:
      mode: DISABLE
---
apiVersion: "authentication.istio.io/v1alpha1"
kind: "Policy"
metadata:
  name: "default"
  namespace: "bookinfo"
spec:
  peers:
  - mtls:
      mode: STRICT
See Also
KIA0208 - PeerAuthentication enabling mTLS found, permissive mode needed
Istio needs both a DestinationRule and PeerAuthentication to enable mTLS communications. The PeerAuthentication configures the authentication method accepted for all the targeted workloads. The DestinationRule defines which is the authentication method that the clients of specific workloads has to start communications with.
Kiali found a DestinationRule starting communications without TLS but there was a PeerAuthentication allowing all services in the mesh to accept only requests in mTLS.
Resolution
There are two ways to fix this situation. You can either change the PeerAuthentication to enable PERMISSIVE mode to all the workloads in the mesh or change the DestinatonRule to enable mTLS instead of disabling it (change the mode to ISTIO_MUTUAL).
Severity
Error
Example
apiVersion: "networking.istio.io/v1alpha3"
kind: "DestinationRule"
metadata:
  name: "default"
  namespace: "bookinfo"
spec:
  host: "*.bookinfo.svc.cluster.local"
  trafficPolicy:
    tls:
      mode: DISABLE
---
apiVersion: "security.istio.io/v1beta1"
kind: "PeerAuthentication"
metadata:
  name: "default"
  namespace: "istio-system"
spec:
  mtls:
    mode: STRICT
See Also
KIA0209 - DestinationRule Subset has not labels
A DestinationRule subset without labels may miss the destination endpoint linked with a specific workload.
If there is any other subset with valid labels, the severity of this warning is changed to Info.
Resolution
Validate that a subset is properly configured.
Severity
Warning
See Also
Gateways
KIA0301 - More than one Gateway for the same host port combination
Gateway creates a proxy that forwards the inbound traffic for the exposed ports. If two different gateways expose the same ports for the same host, this creates ambiguity inside Istio as either of these gateways could handle the traffic. This is most likely a configuration error. This check is done across all namespaces the user has access to.
There is one exception: when both gateways points to a different ingress. Then the ambiguity doesn’t exist and, in consequence, no validation is shown. Kiali considers that two gateways points to the same ingress if they share the exact same selector.
Resolution
Remove the duplicate gateway entries or merge the two gateway definitions into a single one.
Severity
Warning
Example
apiVersion: networking.istio.io/v1alpha3
kind: Gateway
metadata:
  name: bookinfo-gateway # Validation shown
  namespace: bookinfo
spec:
  selector:
    istio: ingressgateway # use istio default controller
  servers:
  - port:
      number: 80
      name: http
      protocol: HTTP
    hosts:
    - "*"
---
apiVersion: networking.istio.io/v1alpha3
kind: Gateway
metadata:
  name: bookinfo-gateway-copy # Validation shown
  namespace: bookinfo2
spec:
  selector:
    istio: ingressgateway # use istio default controller
  servers:
  - port:
      number: 80
      name: http
      protocol: HTTP
    hosts:
    - "*"
---
apiVersion: networking.istio.io/v1alpha3
kind: Gateway
metadata:
  name: bookinfo-gateway-diff-ingress # No validations shown
  namespace: bookinfo
spec:
  selector:
    istio: ingressgateway-pub # Using different ingress
  servers:
  - port:
      number: 80
      name: http
      protocol: HTTP
    hosts:
    - "*"
---
See Also
KIA0302 - No matching workload found for gateway selector in this namespace
This validation checks the current namespace for matching workloads as this is recommended, and potentially in the future required, by the Istio. Excluded from this check are the default “istio-ingressgateway” and “istio-egressgateway” workloads which are included in Istio by default.
Although your traffic might be correctly routed to a workload in other namespace, this is not a guaranteed behavior and thus a warning is flagged in such cases also.
Resolution
Deploy the missing workload or fix the selector to target a correct location.
Severity
Warning
Example
apiVersion: networking.istio.io/v1alpha3
kind: Gateway
metadata:
  name: bookinfo-gateway
  namespace: bookinfo
spec:
  selector:
    app: nonexisting # workload doesn't exist in the namespace
  servers:
  - port:
      number: 80
      name: http
      protocol: HTTP
    hosts:
    - "*"
See Also
Mesh Policies
KIA0401 - Mesh-wide Destination Rule enabling mTLS is missing
Istio has the ability to define mTLS communications at mesh level. In order to do that, Istio needs one DestinationRule and one PeerAuthentication. The DestinationRule configures all the clients of the mesh to use mTLS protocol on their connections. The PeerAuthentication defines what authentication methods can be accepted on the workload of the whole mesh. If the DestinationRule is not found or doesn’t exist and the PeerAuthentication is on STRICT mode, all the communication returns 500 errors.
This validation appears only when autoMtls is disabled.
Resolution
Add a DestinationRule with “*.cluster” host and ISTIO_MUTUAL as tls trafficPolicy mode. The DestinationRule should be like this.
Severity
Error
Example
# Make sure there isn't any DestinationRule enabling meshwide mTLS
apiVersion: "security.istio.io/v1beta1"
kind: "PeerAuthentication"
metadata:
  name: "default"
  namespace: "istio-system"
spec:
  mtls:
    mode: STRICT
See Also
PeerAuthentication
KIA0501 - Destination Rule enabling namespace-wide mTLS is missing
Istio has the ability to define mTLS communications at namespace level. In order to do that, Istio needs one DestinationRule and one PeerAuthentication. The DestinationRule configures all the clients of the namespace to use mTLS protocol on their connections. The PeerAuthentication defines what authentication methods can be accepted on a specific group of workloads. PeerAuthentications without target field specified will target all the workloads within its namespace. If the DestinationRule is not found or doesn’t exist in the namespace and the namespace-wide PeerAuthentication is on STRICT mode, all the communication will return 500 errors.
This validation appears only when autoMtls is disabled.
Resolution
Add a DestinationRule with “*.namespace.svc.cluster.local” host and ISTIO_MUTUAL as tls trafficPolicy mode. The DestinationRule should be like this.
Severity
Error
Example
# Make sure there isn't any DestinationRule enabling meshwide mTLS
apiVersion: "security.istio.io/v1beta1"
kind: "PeerAuthentication"
metadata:
  name: "default"
  namespace: "bookinfo"
spec:
  mtls:
    mode: STRICT
See Also
KIA0505 - Destination Rule disabling namespace-wide mTLS is missing
PeerAuthentication objects are used to define the authentication methods that a set of workloads can accept: Mutual, Istio Mutual, Simple or Disabled.
This validation warns the scenario where there is one PeerAuthentication at namespace level with DISABLE mode but there is DestinationRule at namespace or mesh level enabling mTLS. With this scenario, all the traffic flowing between the services in that namespace will fail.
Resolution
You can either change the namespace/mesh-wide Destination Rule to DISABLE mode or change the current PeerAuthentication to allow mTLS (mode STRICT or PERMISSIVE).
Severity
Error
Example
apiVersion: "security.istio.io/v1beta1"
kind: "PeerAuthentication"
metadata:
  name: "default"
  namespace: "bookinfo"
spec:
  mtls:
    mode: DISABLE
---
apiVersion: "networking.istio.io/v1alpha3"
kind: "DestinationRule"
metadata:
  name: "enable-mtls"
  namespace: bookinfo
spec:
  host: "*.bookinfo.svc.cluster.local"
  trafficPolicy:
    tls:
      mode: ISTIO_MUTUAL
See Also
KIA0506 - Destination Rule disabling mesh-wide mTLS is missing
PeerAuthentication objects are used to define the authentication methods that a set of workloads can accept: Mutual, Istio Mutual, Simple or Disabled.
This validation warns the scenario where there is one PeerAuthentication at mesh level with DISABLE mode but there is DestinationRule at mesh level enabling mTLS. With this scenario, all the traffic flowing between the services in that namespace will fail.
Resolution
You can either change the mesh-wide Destination Rule to DISABLE mode or change the current PeerAuthentication to allow mTLS (mode STRICT or PERMISSIVE).
Severity
Error
Example
apiVersion: "security.istio.io/v1beta1"
kind: "PeerAuthentication"
metadata:
  name: "default"
  namespace: "istio-system"
spec:
  mtls:
    mode: DISABLE
---
apiVersion: "networking.istio.io/v1alpha3"
kind: "DestinationRule"
metadata:
  name: "enable-mtls"
  namespace: bookinfo
spec:
  host: "*.local"
  trafficPolicy:
    tls:
      mode: ISTIO_MUTUAL
See Also
Ports
KIA0601 - Port name must follow [-suffix] form
Istio requires the service ports to follow the naming form of ‘protocol-suffix’ where the ‘-suffix’ part is optional. If the naming does not match this form (or is undefined), Istio treats all the traffic TCP instead of the defined protocol in the definition. Dash is a required character between protocol and suffix. For example, ‘http2foo’ is not valid, while ‘http2-foo’ is (for http2 protocol).
Resolution
Rename the service port name field to follow the form and the traffic flows correctly.
Severity
Error
Example
apiVersion: v1
kind: Service
metadata:
  name: ratings-java-svc
  namespace: bookinfo
  labels:
    app: ratings
    service: ratings-svc
spec:
  ports:
  - port: 9080
    name: wrong-http
  selector:
    app: ratings-java
    version: v1
See Also
KIA0602 - Port appProtocol must follow form
Istio also optionally supports the appProtocol in service ports, following the form of ‘protocol’. When port name field does not contain the protocol the appProtocol field is considered as a protocol. If the naming does not match this form, Istio treats all the traffic TCP instead of the defined protocol in the definition.
Resolution
Rename the service port appProtocol field to follow the form and the traffic flows correctly.
Severity
Error
Example
apiVersion: v1
kind: Service
metadata:
  name: ratings-java-svc
  namespace: bookinfo
  labels:
    app: ratings
    service: ratings-svc
spec:
  ports:
  - port: 3306
    name: database
    appProtocol: wrong-mysql
  selector:
    app: ratings-java
    version: v1
See Also
Services
KIA0701 - Deployment exposing same port as Service not found
Service definition has a combination of labels and port definitions that are not matching to any workloads. This means the deployment will be unsuccessful and no traffic can flow between these two resources. The port is read from the Service ‘TargetPort’ definition first and if undefined, the ‘Port’ field is used as Kubernetes defaults the ‘TargetPort’ to ‘Port’. If the ‘TargetPort’ is using a integer, the port numbers are compared and if the ‘TargetPort’ is a string, the deployment’s portName is used for comparison.
Resolution
Fix the port definitions in the workload or in the service definition to ensure they match.
Severity
Warning
Example
Invalid example with port definitions unmatched:
apiVersion: v1
kind: Service
metadata:
  name: ratings-java-svc
  namespace: ratings-java
  labels:
    app: ratings
    service: ratings-svc
spec:
  ports:
  - port: 9080
    name: http
  selector:
    app: ratings-java
    version: v1
---
apiVersion: extensions/v1beta1
kind: Deployment
metadata:
  name: ratings-java
  namespace: ratings-java
  labels:
    app: ratings-java
    version: v1
spec:
  replicas: 1
  template:
    metadata:
      annotations:
         sidecar.istio.io/inject: "true"
      labels:
        app: ratings-java
        version: v1
    spec:
      containers:
      - name: ratings-java
        image: pilhuhn/ratings-java:f
        imagePullPolicy: IfNotPresent
        ports:
        - containerPort: 8080
Valid example using targetPort definition matching:
apiVersion: v1
kind: Service
metadata:
  name: ratings-java-svc
  namespace: ratings-java
  labels:
    app: ratings
    service: ratings-svc
spec:
  ports:
  - port: 9080
    targetPort: 8080
    name: http
  selector:
    app: ratings-java
    version: v1
---
apiVersion: extensions/v1beta1
kind: Deployment
metadata:
  name: ratings-java
  namespace: ratings-java
  labels:
    app: ratings-java
    version: v1
spec:
  replicas: 1
  template:
    metadata:
      annotations:
         sidecar.istio.io/inject: "true"
      labels:
        app: ratings-java
        version: v1
    spec:
      containers:
      - name: ratings-java
        image: pilhuhn/ratings-java:f
        imagePullPolicy: IfNotPresent
        ports:
        - containerPort: 8080
See Also
Sidecars
KIA1004 - This host has no matching entry in the service registry
The Sidecar resources are used for configuring the sidecar proxies in the service mesh. IstioEgressListener specifies the properties of an outbound traffic listener on the sidecar proxy attached to a workload instance.
In the hosts field, there is the list of hosts exposed to the workload. Each host in the list have the namespace/dnsName format where both namespace and dnsName may have non-obvious values. namespace may be either ., ~, * or an actual namespace name. dnsName has to be a FQDN representing a service, virtual service or a service entry. This FQDN may use the wildcard character.
See more information about the syntax of both namespace and dnsName into istio documentation.
Resolution
Make sure there is a service, virtual service or service entry matching with the host.
Severity
Warning
Example
apiVersion: networking.istio.io/v1alpha3
kind: Sidecar
metadata:
  name: servicenotfound
  namespace: bookinfo
spec:
  workloadSelector:
    labels:
      app: reviews
  egress:
  - port:
      number: 3306
      protocol: MYSQL
      name: egressmysql
    captureMode: NONE
    bind: 127.0.0.1
    hosts:
    - "bookinfo/*.bookinfo.svc.cluster.local" # Bookinfo running into bookinfo ns
    - "default/kiali.io" # Service entry present in the namespace
    - "bookinfo/bogus.bookinfo.svc.cluster.local" # Bogus service into bookinfo doesn't exist
    - "bogus-ns/reviews.bookinfo.svc.cluster.local" # Cross-namespace validation: unable to verify validity
See Also
KIA1006 - Global default sidecar should not have workloadSelector
The Sidecar resources are used for configuring the sidecar proxies in the service mesh. By default, all the sidecars are configured with the default sidecar instance specified in the control plane namespace (usually istio-system). In case there are sidecar resources in the namespaces where your applications are, this default sidecar resource won’t be considered. The sidecar in your namespace will be applied.
Having workloadSelector in your global default sidecar won’t make any effect in the other sidecars living outside of the control plane namespace.
Resolution
Make sure you don’t have the workloadSelector in this global sidecar resource. In case you need specific settings for specific workloads, move those settings to the sidecar resources in your application namespaces.
Severity
Warning
Example
apiVersion: networking.istio.io/v1alpha3
kind: Sidecar
metadata:
  name: default
  namespace: istio-system
spec:
  workloadSelector: # Default sidecar can't have labels
    labels:
      version: v1
  egress:
  - port:
      number: 3306
      protocol: MYSQL
      name: egressmysql
    captureMode: NONE
    bind: 127.0.0.1
    hosts:
    - "bookinfo/reviews.bookinfo.svc.cluster.local"
    - "bookinfo/details.bookinfo.svc.cluster.local"
See Also
VirtualServices
KIA1101 - DestinationWeight on route doesn’t have a valid service (host not found)
VirtualService routes matching requests to a service inside your mesh. Routing can also match a subset of traffic to a certain version of it for example. Any service inside the mesh must be targeted by its name, the IP address are only allowed for hosts defined through a Gateway. Host must be in a short name or FQDN format. Short name will evaluate to VS' namespace, regardless of where the actual service might be placed.
If the host is not found, Istio ignores the defined rules. However, if a subset with a Destination Rule is not found it affects all the subsets and all the routings. As such, care must be taken that the Destination rule is available before deploying the Virtual Service.
Resolution
Correct the host to point to a correct service (in this namespace or with FQDN to other namespaces), deploy the missing service to the mesh or remove the configuration linking to that non-existing service.
Severity
Error
Example
apiVersion: networking.istio.io/v1alpha3
kind: VirtualService
metadata:
  name: details
spec:
  hosts:
  - details
  http:
  - route:
    - destination:
        host: nonexistentsvc
        subset: v2
See Also
KIA1102 - VirtualService is pointing to a non-existent gateway
By default, VirtualService routes apply to sidecars inside the mesh. The gateway field allows to override that default and if anything is defined, the VS applies to those selected. ‘mesh’ is a reserved gateway name and means all the sidecars in the mesh. If one wishes to apply the VS to gateways as well as the sidecars, the ‘mesh’ keyword must be used as one of the gateways. Incorrect gateways mean that the VS is not applied correctly.
Resolution
Fix the possible gateway field to target all necessary gateways or remove the field if the default ‘mesh’ is enough.
Severity
Error
Example
apiVersion: networking.istio.io/v1alpha3
kind: VirtualService
metadata:
  name: details
spec:
  hosts:
  - details
  gateways:
  - non-existent-gateway
  http:
  - route:
    - destination:
        host: details
        subset: v1
See Also
KIA1104 - The weight is assumed to be 100 because there is only one route destination
Istio assumes the weight to be 100 when there is only one HTTPRouteDestination or RouteDestination. The warning is present because there is one route with a weight less than 100.
Resolution
Either remove the weight field or you might want to add another RouteDestination with an specific weight.
Severity
Warning
Example
apiVersion: networking.istio.io/v1alpha3
kind: VirtualService
metadata:
  name: reviews
spec:
  hosts:
    - reviews
  http:
  - route:
    - destination:
        host: reviews
        subset: v1
      weight: 10
See Also
- Istio documentation about HTTP Route Destination struct
- Istio documentation about Route Destination struct
- Validator source code
KIA1105 - This host subset combination is already referenced in another route destination
Istio allows you to apply rules over the traffic targetting to a specific service. In order to achieve that, it is necessary to add those rules into either http, tcp or tls fields in a VirtualService. In each field it is possible to specify rules for redirection or forwarding traffic. Those rules are the RouteDestination and HTTPRouteDestination structs. Each structs defines where the traffic is shifted to using host and subset fields. This warning message refers to the fact of referencing one host subset combination more than one time within the same route. Galley, Istio module in charge of configuration validation, allows host subset combination duplicity. However, the mesh it might become broken when there are different duplicates. Also, the presented warning might help spoting a typo.
Resolution
Make sure there is only one reference to the same host subset combination for each RouteDestination. Either HTTPRouteDestination or RouteDestination.
Severity
Warning
Example
apiVersion: networking.istio.io/v1alpha3
kind: VirtualService
metadata:
  name: reviews
spec:
  hosts:
    - reviews
  http:
  - route:
    - destination:
        host: reviews
        subset: v1
      weight: 80
    - destination:
        host: reviews
        subset: v2 # duplicate
      weight: 10
    - destination:
        host: reviews
        subset: v2 # duplicate
      weight: 10
See Also
- Istio documentation about HTTP Route Destination struct
- Istio documentation about Route Destination struct
- Validator source code
KIA1106 - More than one Virtual Service for same host
A VirtualService defines a set of traffic routing rules to apply when a host is addressed. Each routing rule defines matching criteria for traffic of a specific protocol. If the traffic is matched, then it is sent to a named destination service (or subset/version of it) defined in the registry.
Resolution
This is a valid configuration only if two VirtualServices share the same host but are bound to a different gateways, sidecars do not accept this behavior. There are several caveats when using this method and defining the same parts in multiple Virtual Service definitions is not recommended. While Istio will merge the configuration, it does not guarantee any ordering for cross-resource merging and only the first seen configuration is applied (rest ignored). As recommended, each VS definition should have a ‘catch-all’ situation, but this can only be defined in a definition affecting the same host.
Severity
Warning
Example
apiVersion: networking.istio.io/v1alpha3
kind: VirtualService
metadata:
  name: reviews
spec:
  hosts:
    - reviews
  http:
  - route:
    - destination:
        host: reviews
        subset: v1
      weight: 90
    - destination:
        host: reviews
        subset: v2
      weight: 10
---
apiVersion: networking.istio.io/v1alpha3
kind: VirtualService
metadata:
  name: reviews-cp
spec:
  hosts:
    - reviews
  http:
  - route:
    - destination:
        host: reviews
        subset: v1
      weight: 90
    - destination:
        host: reviews
        subset: v2
      weight: 10
See Also
- Istio documentation: Split large virtual services and destination rules into multiple resources
- Validator source code
KIA1107 - Subset not found
VirtualService routes matching requests to a service inside your mesh. Routing can also match a subset of traffic to a certain version of it for example. The subsets referred in a VirtualService have to be defined in one DestinationRule.
If one route in the VirtualService points to a subset that doesn’t exist Istio won’t be able to send traffic to a service.
Resolution
Fix the routes that points to a non existing subsets. It might be fixing a typo in the subset’s name or defining the missing subset in a DestinationRule.
Severity
Error
Example
apiVersion: networking.istio.io/v1alpha3
kind: VirtualService
metadata:
  name: reviews
spec:
  hosts:
    - reviews
  http:
  - route:
    - destination:
        host: reviews
        subset: nosubset
      weight: 90
    - destination:
        host: reviews
        subset: v2
      weight: 10
See Also
KIA1108 - Preferred nomenclature: /
A virtual service may include a list of gateways which the defined routes should be applied to. Gateways in other namespaces may be referred to by
Resolution
Move the nomenclature of the gateways into the supported Istio form:
Example
kind: VirtualService
apiVersion: networking.istio.io/v1alpha3
metadata:
  name: bookinfo
  namespace: bookinfo
spec:
  hosts:
    - '*'
  gateways:
    - bookinfo-gateway.bookinfo.svc.cluster.local # unsupported format
    - bookinfo/bookinfo-gateway # works
  http:
    - match:
        - uri:
            exact: /productpage
        - uri:
            prefix: /static
        - uri:
            exact: /login
        - uri:
            exact: /logout
        - uri:
            prefix: /api/v1/products
      route:
        - destination:
            host: productpage
            port:
              number: 9080
---
kind: Gateway
apiVersion: networking.istio.io/v1alpha3
metadata:
  name: bookinfo-gateway
  namespace: bookinfo
spec:
  servers:
    - hosts:
        - '*'
      port:
        name: http
        number: 80
        protocol: HTTP
  selector:
    istio: ingressgateway
See Also
WorkloadEntries
KIA1201 - Missing one or more addresses from matching WorkloadEntries
This validation shows, that the address field’s value of Workload Entry is not matching to any address of Service Entry.
Resolution
Add missing Service Entry which address will match the Workload Entry’s address.
Severity
Warning
Example
apiVersion: networking.istio.io/v1beta1
kind: WorkloadEntry
metadata:
  name: ratings-v1
  namespace: bookinfo
spec:
  serviceAccount: ratings-vm
  address: 3.3.3.3
  labels:
    app: ratings
    version: v1
  ports:
    http: 9080
---
apiVersion: networking.istio.io/v1beta1
kind: ServiceEntry
metadata:
  name: ratings-unmatching-address
  namespace: bookinfo
spec:
  addresses:
    - 4.4.4.4 # This IP is not in any WorkloadEntry. It needs 3.3.3.3 to work.
  hosts:
    - ratings
  location: MESH_INTERNAL
  resolution: STATIC
  ports:
    - number: 9080
      name: http
      protocol: HTTP
      targetPort: 9080
  workloadSelector:
    labels:
      app: ratings-unmatching
See Also
Workloads
KIA1301 - This workload is not covered by any authorization policy
Istio Authorization Policy enables access control on workloads in the mesh. Auth Policy selector will match with workloads in the same namespace as the authorization policy. If the authorization policy is in the root namespace, the selector will additionally match with workloads in all namespaces. This validation shows, that the selector match did not happen.
Resolution
Add Autorization Policy which selector matches with Workload’s label selector.
Severity
Warning
See Also
Generic
KIA0002 - More than one selector-less object in the same namespace
This validation refers to the usage of the selector. Selector-less Istio objects are those objects that don’t have the selector field specified. Therefore, objects that apply to all the workloads of a namespace (or whole mesh if the namespace is the same as the control plane namespace).
This validation warns you that you have two different objects living in the same namespace. This may leave an non-deterministic or unexpected behavior on the workloads of the namespace.
Resolution
The natural solution is to merge both objects. In case there are different behaviors you want to apply, consider to define the selector field targeting a specific set of workloads.
Severity
Error
Example
apiVersion: "security.istio.io/v1beta1"
kind: "PeerAuthentication"
metadata:
  name: "default"
  namespace: "bookinfo"
spec:
  mtls:
    mode: STRICT
---
apiVersion: "security.istio.io/v1beta1"
kind: "PeerAuthentication"
metadata:
  name: "duplicate"
  namespace: "bookinfo"
spec:
  mtls:
    mode: STRICT
See Also
KIA0003 - More than one object applied to the same workload
This validation refers to the usage of the selector. In this field are defined the labels of the workloads that this object will be applied to. It might be one or more workloads in the same namespace.
This validation warns the scenario where there are two different objects applying to the same workload(s). This may leave an undeterministic or unexpected behavior on the workloads of the namespace.
Resolution
There isn’t a standard solution for that. It is a good practice not to have multiple rules of the same kind applying to the same workloads. Otherwise you would end up having interferences between objects and having troubles when debugging. The first approach would be to merge both objects into one if possible. The second approach would be to reorganize the objects of the same kind in a way that each one only applies to a different set of workloads. Applying no change into the objects is also an option although not desiderable.
Severity
Error
Example
apiVersion: "security.istio.io/v1beta1"
kind: "PeerAuthentication"
metadata:
  name: "productpage"
  namespace: "bookinfo"
spec:
  selector:
    matchLabels:
      app: productpage
  mtls:
    mode: STRICT
---
apiVersion: "security.istio.io/v1beta1"
kind: "PeerAuthentication"
metadata:
  name: "productpage-disable-80"
  namespace: "bookinfo"
spec:
  selector:
    matchLabels:
      app: productpage
      version: v1
  mtls:
    mode: STRICT
  portLevelMtls:
    80:
      mode: DISABLE
See Also
KIA0004 - No matching workload found for the selector in this namespace
This validation warns the scenario where there are not workloads matching with the selector labels. In other terms, this object doesn’t have any implication into the mesh.
Resolution
There are three scenarios: either change the labels to match an existing workload (useful with typos), deploy a workload that match with those labels or safely remove this object.
Severity
Warning
Example
apiVersion: "security.istio.io/v1beta1"
kind: "PeerAuthentication"
metadata:
  name: "nomatchingworkloads"
  namespace: "bookinfo"
spec:
  selector:
    matchLabels:
      app: wrong-typo
      version: v1
  mtls:
    mode: STRICT
  portLevelMtls:
    80:
      mode: DISABLE
See Also
KIA0005 - No matching namespace found or namespace is not accessible
This validation error shows that the namespace where the config object is exported is not accessible or does not exist.
Resolution
Choose existing and accessible namespace to export to.
Severity
Error
4 - Tutorials
The following tutorials are designed to help users understand how to use Istio with Kiali, features, configuration, etc. They are highly recommended!
4.1 - Travel Demo Tutorial
This tutorial uses the Kiali Travel Demo to teach Kiali and Istio features.
4.1.1 - Prerequisites
Platform Setup
This tutorial assumes you will have access to a Kubernetes cluster with Istio installed.
This tutorial has been tested using:
Tip
Platform dependent tasks will be indicated with a special note like this.This tutorial has been tested using:
- minikube v1.16.0, istio 1.8.1 and kiali v1.28.0
- openshift v4.8.3, istio 1.11.0 and kiali v1.39.0
Install Istio
Once you have your Kubernetes cluster ready, follow the Istio Getting Started to install and setup a demo profile that will be used in this tutorial.
DNS entries can be added in a basic way to the /etc/hosts file but you can use any other DNS service that allows to resolve a domain with the external Ingress IP.
Minikube
This tutorial uses Minikube tunnel feature for external Ingress IP.OpenShift
This tutorial uses a route for external Ingress IP.Update Kiali
Istio defines a specific Kiali version as an addon.
In this tutorial we are going to update Kiali to the latest release version.
Assuming you have installed the addons following the Istio Getting Started guide, you can uninstall Kiali with the command:
kubectl delete -f ${ISTIO_HOME}/samples/addons/kiali.yaml --ignore-not-found
There are multiple ways to install a recent version of Kiali, this tutorial follows the Quick Start using Helm Chart.
helm install \
  --namespace istio-system \
  --set auth.strategy="anonymous" \
  --repo https://kiali.org/helm-charts \
  kiali-server \
  kiali-server
Access the Kiali UI
The Istio istioctl client has an easy method to expose and access Kiali:
${ISTIO_HOME}/bin/istioctl dashboard kiali
There are other alternatives to expose Kiali or other Addons in Istio. Check Remotely Accessing Telemetry Addons for more information.
After the Prerequisites you should be able to access Kiali. Verify its version by clicking the “?” icon and selecting “About”:

4.1.2 - Install Travel Demo
Deploy the Travel Demo
This demo application will deploy several services grouped into three namespaces.
Note that at this step we are going to deploy the application without any reference to Istio.
We will join services to the ServiceMesh in a following step.
To create and deploy the namespaces perform the following commands:
OpenShift
OpenShift users can substituteoc for kubectl. OpenShift users will need
to add the necessary NetworkAttachmentDefinition to each namespace. Also, the necessary SecurityContextConstraints
for the service accounts defined in the namespace (minimally, default).
kubectl create namespace travel-agency
kubectl create namespace travel-portal
kubectl create namespace travel-control

kubectl apply -f <(curl -L https://raw.githubusercontent.com/kiali/demos/master/travels/travel_agency.yaml) -n travel-agency
kubectl apply -f <(curl -L https://raw.githubusercontent.com/kiali/demos/master/travels/travel_portal.yaml) -n travel-portal
kubectl apply -f <(curl -L https://raw.githubusercontent.com/kiali/demos/master/travels/travel_control.yaml) -n travel-control
Check that all deployments rolled out as expected:
$ kubectl get deployments -n travel-control
NAME      READY   UP-TO-DATE   AVAILABLE   AGE
control   1/1     1            1           85s

$ kubectl get deployments -n travel-portal
NAME      READY   UP-TO-DATE   AVAILABLE   AGE
travels   1/1     1            1           91s
viaggi    1/1     1            1           91s
voyages   1/1     1            1           91s

$ kubectl get deployments -n travel-agency
NAME            READY   UP-TO-DATE   AVAILABLE   AGE
cars-v1         1/1     1            1           96s
discounts-v1    1/1     1            1           96s
flights-v1      1/1     1            1           96s
hotels-v1       1/1     1            1           96s
insurances-v1   1/1     1            1           96s
mysqldb-v1      1/1     1            1           96s
travels-v1      1/1     1            1           96s
Understanding the demo application
Travel Portal namespace
The Travel Demo application simulates two business domains organized in different namespaces.
In a first namespace called travel-portal there will be deployed several travel shops, where users can search for and book flights, hotels, cars or insurance.
The shop applications can behave differently based on request characteristics like channel (web or mobile) or user (new or existing).
These workloads may generate different types of traffic to imitate different real scenarios.
All the portals consume a service called travels deployed in the travel-agency namespace.
Travel Agency namespace
A second namespace called travel-agency will host a set of services created to provide quotes for travel.
A main travels service will be the business entry point for the travel agency. It receives a destination city and a user as parameters and it calculates all elements that compose a travel budget: airfare, lodging, car reservation and travel insurance.
Each service can provide an independent quote and the travels service must then aggregate them into a single response.
Additionally, some users, like registered users, can have access to special discounts, managed as well by an external service.
Service relations between namespaces can be described in the following diagram:

Travel Portal and Travel Agency flow
A typical flow consists of the following steps:
. A portal queries the travels service for available destinations. . Travels service queries the available hotels and returns to the portal shop. . A user selects a destination and a type of travel, which may include a flight and/or a car, hotel and insurance. . Cars, Hotels and Flights may have available discounts depending on user type.
Travel Control namespace
The travel-control namespace runs a business dashboard with two key features:
- Allow setting changes for every travel shop simulator (traffic ratio, device, user and type of travel).
- Provide a business view of the total requests generated from the travel-portal namespace to the travel-agency services, organized by business criteria as grouped per shop, per type of traffic and per city.

4.1.3 - First Steps
Missing Sidecars
The Travel Demo has been deployed in the previous step but without installing any Istio sidecar proxy.
In that case, the application won’t connect to the control plane and won’t take advantage of Istio’s features.
In Kiali, we will see the new namespaces in the overview page:

But we won’t see any traffic in the graph page for any of these new namespaces:

If we examine the Applications, Workloads or Services page, it will confirm that there are missing sidecars:

Enable Sidecars
In this tutorial, we will add namespaces and workloads into the ServiceMesh individually step by step.
This will help you to understand how Istio sidecar proxies work and how applications can use Istio’s features.
We are going to start with the control workload deployed into the travel-control namespace:
Step 1
Enable Auto Injection on the travel-control namespace
Step 2
Enable Auto Injection for control workload
Understanding what happened:
(ii) Automatic Sidecar Injection
Open Travel Demo to Outside Traffic
The control workload now has an Istio sidecar proxy injected but this application is not accessible from the outside.
In this step we are going to expose the control service using an Istio Ingress Gateway which will map a path to a route at the edge of the mesh.
Step 1
Create a DNS entry for the control service associated with the External IP of the Istio IngressMinikube
Kubernetes Service EXTERNAL-IP for “LoadBalancer” TYPE is provided in minikube plaform using the minikube tunnel tool.For minikube we will check the External IP of the Ingress gateway:
$ kubectl get services/istio-ingressgateway -n istio-system
NAME                   TYPE           CLUSTER-IP     EXTERNAL-IP    PORT(S)                                                                      AGE
istio-ingressgateway   LoadBalancer   10.101.6.144   10.101.6.144   15021:30757/TCP,80:32647/TCP,443:30900/TCP,31400:30427/TCP,15443:31072/TCP   19h
And we will add a simple entry to the /etc/hosts of the tutorial machine with the desired DNS entry:
...
10.101.6.144 control.travel-control.istio-cluster.org
...
Then, from this machine, the url control.travel-control.istio-cluster.org will resolve to the External IP of the Ingress Gateway of Istio.
OpenShift
OpenShift does not provide the Kubernetes Service EXTERNAL-IP for “LoadBalancer” TYPE. Instead, you can expose the istio-ingressgateway service.For OpenShift we will expose the Ingress gateway as a service:
$ oc expose service istio-ingressgateway -n istio-system
$ oc get routes -n istio-system
NAME                   HOST/PORT                                  PATH   SERVICES               PORT    TERMINATION          WILDCARD
istio-ingressgateway   <YOUR_ROUTE_HOST>                                 istio-ingressgateway   http2                        None
Then, from this machine, the host <YOUR_ROUTE_HOST> will resolve to the External IP of the Ingress Gateway of Istio. For OpenShift we will
not define a DNS entry, instead, where you see control.travel-control.istio-cluster.org in the steps below, subsitute the value of <YOUR_ROUTE_HOST>.
Step 2
Use the Request Routing Wizard on the control service to generate a traffic rule
Use “Add Route Rule” button to add a default rule where any request will be routed to the control workload.

Use the Advanced Options and add a gateway with host control.travel-control.istio-cluster.org and create the Istio config.

Verify the Istio configuration generated.

Step 3
Test the control service by pointing your browser to\http://control.travel-control.istio-cluster.org

Step 4
Review travel-control namespace in Kiali
Understanding what happened:
- External traffic enters into the cluster through a Gateway
- Traffic is routed to the control service through a VirtualService
- Kiali Graph visualizes the traffic telemetry reported from the control sidecar proxy
- Only the travel-control namespace is part of the mesh
4.1.4 - Observe
Enable Sidecars in all workloads
An Istio sidecar proxy adds a workload into the mesh.
Proxies connect with the control plane and provide Service Mesh functionality.
Automatically providing metrics, logs and traces is a major feature of the sidecar.
In the previous steps we have added a sidecar only in the travel-control namespace’s control workload.
We have added new powerful features but the application is still missing visibility from other workloads.
Step 1
Switch to the Workload graph and select multiple namespaces to identify missing sidecars in the Travel Demo application
That control workload provides good visibility of its traffic, but telemetry is partially enabled, as travel-portal and travel-agency workloads don’t have sidecar proxies.
Step 2
Enable proxy injection in travel-portal and travel-agency namespacesIn the First Steps of this tutorial we didn’t inject the sidecar proxies on purpose to show a scenario where only some workloads may have sidecars.
Typically, Istio users annotate namespaces before the deployment to allow Istio to automatically add the sidecar when the application is rolled out into the cluster. Perform the following commands:
kubectl label namespace travel-agency istio-injection=enabled
kubectl label namespace travel-portal istio-injection=enabled

kubectl rollout restart deploy -n travel-portal
kubectl rollout restart deploy -n travel-agency
Verify that travel-control, travel-portal and travel-agency workloads have sidecars deployed:

Step 3
Verify updated telemetry for travel-portal and travel-agency namespaces
Graph walkthrough
The graph provides a powerful set of Graph Features to visualize the traffic topology of the service mesh.
In this step, we will show how to use the Graph to show relevant information in the context of the Travel Demo application.
Our goal will be to identify the most critical service of the demo application.
Step 1
Select all travel- namespaces in the graph and enable Traffic Distribution edge labels in the Display Options:
Review the status of the mesh, everything seems healthy, but also note that hotels service has more load compared to other services inlcuded in the travel-agency namespace.
Step 2
Select the hotels service, use the graph side-panel to select a trace from the Traces tab:
Combining telemetry and tracing information will show that there are traces started from a portal that involve multiple services but also other traces that only consume the hotels service.

Step 3
Select the main travels application and double-click to zoom in
The graph can focus on an element to study a particular context in detail. Note that a contextual menu is available using right-click, to easily shortcut the navigation to other sections.
Application details
Kiali provides Detail Views to navigate into applications, workloads and services.
These views provide information about the structure, health, metrics, logs, traces and Istio configuration for any application component.
In this tutorial we are going to learn how to use them to examine the main travels application of our example.
Step 1
Navigate to the travels application
An application is an abstract group of workloads and services labeled with the same “application” name.
From Service Mesh perspective this concept is significant as telemetry and tracing signals are mainly grouped by “application” even if multiple workloads are involved.
At this point of the tutorial, the travels application is quite simple, just a travels-v1 workload exposed through the travels service. Navigate to the travels-v1 workload detail by clicking the link in the travels application overview.

Step 2
Examine Outbound Metrics of travels-v1 workload
The Metrics tab provides a powerful visualization of telemetry collected by the Istio proxy sidecar. It presents a dashboard of charts, each of which can be expanded for closer inspection. Expand the Request volume chart:

Metrics Settings provides multiple predefined criteria out-of-the-box. Additionally, enable the spans checkbox to correlate metrics and tracing spans in a single chart.
We can see in the context of the Travels application, the hotels service request volume differs from that of the other travel-agency services.
By examining the Request Duration chart also shows that there is no suspicious delay, so probably this asymmetric volume is part of the application business' logic.
Step 3
Review Logs of travels-v1 workloadThe Logs tab provides a unified view of application container logs with the Istio sidecar proxy logs. It also offers a spans checkbox, providing a correlated view of both logs and tracing, helping identify spans of interest.
From the application container log we can spot that there are two main business methods: GetDestinations and GetTravelQuote.
In the Istio sidecar proxy log we see that GetDestinations invokes a GET /hotels request without parameters.

However, GetTravelQuote invokes multiple requests to other services using a specific city as a parameter.

Then, as discussed in the Travel Demo design, an initial query returns all available hotels before letting the user choose one and then get specific quotes for other destination services.
That scenario is shown in the increase of the hotels service utilization.
Step 4
Review Traces of workload-v1Now we have identified that the hotels service has more use than other travel-agency services.
The next step is to get more context to answer if some particular service is acting slower than expected.
The Traces tab allows comparison between traces and metrics histograms, letting the user determine if a particular spike is expected in the context of average values.

In the same context, individual spans can be compared in more detail, helping to identify a problematic step in the broader scenario.

4.1.5 - Connect
Request Routing
The Travel Demo application has several portals deployed on the travel-portal namespace consuming the travels service deployed on the travel-agency namespace.
The travels service is backed by a single workload called travels-v1 that receives requests from all portal workloads.
At a moment of the lifecycle the business needs of the portals may differ and new versions of the travels service may be necessary.
This step will show how to route requests dynamically to multiple versions of the travels service.
Step 1
Deploy travels-v2 and travels-v3 workloadskubectl apply -f <(curl -L https://raw.githubusercontent.com/kiali/demos/master/travels/travels-v2.yaml) -n travel-agency
kubectl apply -f <(curl -L https://raw.githubusercontent.com/kiali/demos/master/travels/travels-v3.yaml) -n travel-agency

As there is no specific routing defined, when there are multiple workloads for travels service the requests are uniformly distributed.

Step 2
Investigate the http headers used by the Travel Demo applicationIn our scenario we would like to perform the following routing logic:
- All traffic from travels.uk routed to travels-v1
- All traffic from viaggi.it routed to travels-v2
- All traffic from voyages.fr routed to travels-v3
Portal workloads use HTTP/1.1 protocols to call the travels service, so one strategy could be to use the HTTP headers to define the matching condition.
But, where to find the HTTP headers ? That information typically belongs to the application domain and we should examine the code, documentation or dynamically trace a request to understand which headers are being used in this context.
There are multiple possibilities. The Travel Demo application uses an Istio Annotation feature to add an annotation into the Deployment descriptor, which adds additional Istio configuration into the proxy.

In our example the HTTP Headers are added as part of the trace context.
Then tracing will populate custom tags with the portal, device, user and travel used.
Step 3
Use the Request Routing Wizard on travels service to generate a traffic rule
We will define three “Request Matching” rules as part of this request routing. Define all three rules before clicking the Create button.
In the first rule, we will add a request match for when the portal header has the value of travels.uk.
Define the exact match, like below, and click the “Add Match” button to update the “Matching selected” for this rule.

Move to “Route To” tab and update the destination for this “Request Matching” rule. Then use the “Add Route Rule” to create the first rule.

Add similar rules to route traffic from viaggi.it to travels-v2 workload and from voyages.fr to travels-v3 workload.
When the three rules are defined you can use “Create” button to generate all Istio configurations needed for this scenario. Note that the rule ordering does not matter in this scenario.

The Istio config for a given service is found on the “Istio Config” card, on the Service Details page.

Step 4
Verify that the Request Routing is working from the travels-portal GraphOnce the Request Routing is working we can verify that outbound traffic from every portal goes to the single travels workload. To see this clearly use a “Workload Graph” for the “travel-portal” namespace, enable “Traffic Distribution” edge labels and disable the “Service Nodes” Display option:

Note that no distribution label on an edge implies 100% of traffic.
Examining the “Inbound Traffic” for any of the travels workloads will show a similar pattern in the telemetry.

Using a custom time range to select a large interval, we can see how the workload initially received traffic from all portals but then only a single portal after the Request Routing scenarios were defined.
Step 5
Update or delete Istio ConfigurationKiali Wizards allow you to define high level Service Mesh scenarios and will generate the Istio Configuration needed for its implementation (VirtualServices, DestinationRules, Gateways and PeerRequests). These scenarios can be updated or deleted from the “Actions” menu of a given service.
To experiment further you can navigate to the travels service and update your configuration by selecting “Request Routing”, as shown below. When you have finished experimenting with Routing Request scenarios then use the “Actions” menu to delete the generated Istio config.

Fault Injection
The Observe step has spotted that the hotels service has additional traffic compared with other services deployed in the travel-agency namespace.
Also, this service becomes critical in the main business logic. It is responsible for querying all available destinations, presenting them to the user, and getting a quote for the selected destination.
This also means that the hotels service may be one of the weakest points of the Travel Demo application.
This step will show how to test the resilience of the Travel Demo application by injecting faults into the hotels service and then observing how the application reacts to this scenario.
Step 1
Use the Fault Injection Wizard on hotels service to inject a delay
Select an HTTP Delay and specify the “Delay percentage” and “Fixed Delay” values. The default values will introduce a 5 seconds delay into 100% of received requests.

Step 2
Understanding source and destination metricsTelemetry is collected from proxies and it is labeled with information about the source and destination workloads.
In our example, let’s say that travels service (“Service A” in the Istio diagram below) invokes the hotels service (“Service B” in the diagram). Travels is the “source” workload and hotels is the “destination” workload. The travels proxy will report telemetry from the source perspective and hotels proxy will report telemetry from the destination perspective. Let’s look at the latency reporting from both perspectives.

The travels workload proxy has the Fault Injection configuration so it will perform the call to the hotels service and will apply the delay on the travels workload side (this is reported as source telemetry).
We can see in the hotels telemetry reported by the source (the travels proxy) that there is a visible gap showing 5 second delay in the request duration.

But as the Fault Injection delay is applied on the source proxy (travels), the destination proxy (hotels) is unaffected and its destination telemetry show no delay.

Step 3
Study the impact of the travels service delayThe injected delay is propagated from the travels service to the downstream services deployed on travel-portal namespace, degrading the overall response time. But the downstream services are unaware, operate normally, and show a green status.

Step 4
Update or delete Istio ConfigurationAs part of this step you can update the Fault Injection scenario to test different delays. When finished, you can delete the generated Istio config for the hotels service.
Traffic Shifting
In the previous Request Routing step we have deployed two new versions of the travels service using the travels-v2 and travels-v3 workloads.
That scenario showed how Istio can route specific requests to specific workloads. It was configured such that each portal deployed in the travel-portal namespace (travels.uk, viaggi.it and voyages.fr) were routed to a specific travels workload (travels-v1, travels-v2 and travels-v3).
This Traffic Shifting step will simulate a new scenario: the new travels-v2 and travels-v3 workloads will represent new improvements for the travels service that will be used by all requests.
These new improvements implemented in travels-v2 and travels-v3 represent two alternative ways to address a specific problem. Our goal is to test them before deciding which one to use as a next version.
At the beginning we will send 80% of the traffic into the original travels-v1 workload, and will split 10% of the traffic each on travels-v2 and travels-v3.
Step 1
Use the Traffic Shifting Wizard on travels service
Create a scenario with 80% of the traffic distributed to travels-v1 workload and 10% of the traffic distributed each to travels-v2 and travels-v3.

Step 2
Examine Traffic Shifting distribution from the travels-agency Graph
Step 3
Compare travels workload and assess new changes proposed in travels-v2 and travels-v3Istio Telemetry is grouped per logical application. That has the advantage of easily comparing different but related workloads, for one or more services.
In our example, we can use the “Inbound Metrics” and “Outbound Metrics” tabs in the travels application details, group by “Local version” and compare how travels-v2 and travels-v3 are working.


The charts show that the Traffic distribution is working accordingly and 80% is being distributed to travels-v1 workload and they also show no big differences between travels-v2 and travels-v3 in terms of request duration.
Step 4
Update or delete Istio ConfigurationAs part of this step you can update the Traffic Shifting scenario to test different distributions. When finished, you can delete the generated Istio config for the travels service.
TCP Traffic Shifting
The Travel Demo application has a database service used by several services deployed in the travel-agency namespace.
At some point in the lifecycle of the application the telemetry shows that the database service degrades and starts to increase the average response time.
This is a common situation. In this case, a database specialist suggests an update of the original indexes due to the data growth.
Our database specialist is suggesting two approaches and proposes to prepare two versions of the database service to test which may work better.
This step will show how the “Traffic Shifting” strategy can be applied to TCP services to test which new database indexing strategy works better.
Step 1
Deploy mysqldb-v2 and mysqldb-v3 workloadsTo deploy the new versions of the mysqldb service execute the commands:
kubectl apply -f <(curl -L https://raw.githubusercontent.com/kiali/demos/master/travels/mysql-v2.yaml) -n travel-agency
kubectl apply -f <(curl -L https://raw.githubusercontent.com/kiali/demos/master/travels/mysql-v3.yaml) -n travel-agency
Step 2
Use the TCP Traffic Shifting Wizard on mysqldb service
Create a scenario with 80% of the traffic distributed to mysqldb-v1 workload and 10% of the traffic distributed each to mysqldb-v2 and mysqldb-v3.

Step 3
Examine Traffic Shifting distribution from the travels-agency Graph
Note that TCP telemetry has different types of metrics, as “Traffic Distribution” is only available for HTTP/gRPC services, for this service we need to use “Traffic Rate” to evaluate the distribution of data (bytes-per-second) between mysqldb workloads.
Step 4
Compare mysqldb workload and study new indexes proposed in mysqldb-v2 and mysqldb-v3TCP services have different telemetry but it’s still grouped by versions, allowing the user to compare and study pattern differences for mysqldb-v2 and mysqldb-v3.

The charts show more peaks in mysqldb-v2 compared to mysqldb-v3 but overall a similar behavior, so it’s probably safe to choose either strategy to shift all traffic.
Step 5
Update or delete Istio ConfigurationAs part of this step you can update the TCP Traffic Shifting scenario to test a different distribution. When finished, you can delete the generated Istio config for the mysqldb service.
Request Timeouts
In the Fault Injection step we showed how we could introduce a delay in the critical hotels service and test the resilience of the application.
The delay was propagated across services and Kiali showed how services accepted the delay without creating errors on the system.
But in real scenarios delays may have important consequences. Services may prefer to fail sooner, and recover, rather than propagating a delay across services.
This step will show how to add a request timeout for one of the portals deployed in travel-portal namespace. The travel.uk and viaggi.it portals will accept delays but voyages.fr will timeout and fail.
Step 1
Use the Fault Injection Wizard on hotels service to inject a delayRepeat the Fault Injection step to add delay on hotels service.
Step 2
Use the Request Routing Wizard on travels service to add a route rule with delay for voyages.frAdd a rule to add a request timeout only on requests coming from voyages.fr portal:
- Use the Request Matching tab to add a matching condition for the portal header with voyages.fr value.
- Use the Request Timeouts tab to add an HTTP Timeout for this rule.
- Add the rule to the scenario.

A first rule should be added to the list like:

Add a second rule to match any request and create the scenario. With this configuration, requests coming from voyages.fr will match the first rule and all others will match the second rule.

Step 3
Review the impact of the request timeout in the travels serviceCreate the rule. The Graph will show how requests coming from voyages.fr start to fail, due to the request timeout introduced.
Requests coming from other portals work without failures but are degraded by the hotels delay.

This scenario can be visualized in detail if we examine the “Inbound Metrics” and we group by “Remote app” and “Response code”.


As expected, the requests coming from voyages.fr don’t propagate the delay and they fail in the 2 seconds range, meanwhile requests from other portals don’t fail but they propagate the delay introduced in the hotels service.
Step 4
Update or delete Istio ConfigurationAs part of this step you can update the scenarios defined around hotels and travels services to experiment with more conditions, or you can delete the generated Istio config in both services.
Circuit Breaking
Distributed systems will benefit from failing quickly and applying back pressure, as opposed to propagating delays and errors through the system.
Circuit breaking is an important technique used to limit the impact of failures, latency spikes, and other types of network problems.
This step will show how to apply a Circuit Breaker into the travels service in order to limit the number of concurrent requests and connections.
Step 1
Deploy a new loadtester portal in the travel-portal namespaceIn this example we are going to deploy a new workload that will simulate an important increase in the load of the system.
OpenShift
OpenShift users may need to also add the associated loadtester serviceaccount to the necessary securitycontextcontraints.kubectl apply -f <(curl -L https://raw.githubusercontent.com/kiali/demos/master/travels/travel_loadtester.yaml) -n travel-portal
The loadtester workload will try to create 50 concurrent connections to the travels service, adding considerable pressure to the travels-agency namespace.

The Travel Demo application is capable of handling this load and in a first look it doesn’t show unhealthy status.

But in a real scenario an unexpected increase in the load of a service like this may have a significant impact in the overall system status.
Step 2
Use the Traffic Shifting Wizard on travels service to generate a traffic ruleUse the “Traffic Shifting” Wizard to distribute traffic (evenly) to the travels workloads and use the “Advanced Options” to add a “Circuit Breaker” to the scenario.

The “Connection Pool” settings will indicate that the proxy sidecar will reject requests when the number of concurrent connections and requests exceeds more than one.
The “Outlier Detection” will eject a host from the connection pool if there is more than one consecutive error.
Step 3
Study the behavior of the Circuit Breaker in the travels serviceIn the loadtester versioned-app Graph we can see that the travels service’s Circuit Breaker accepts some, but fails most, connections.
Remember, that these connections are stopped by the proxy on the loadtester side. That “fail sooner” pattern prevents overloading the network.
Using the Graph we can select the failed edge, check the Flags tab, and see that those requests are closed by the Circuit breaker.

If we examine the “Request volume” metric from the “Outbound Metrics” tab we can see the evolution of the requests, and how the introduction of the Circuit Breaker made the proxy reduce the request volume.

Step 4
Update or delete Istio ConfigurationAs part of this step you can update the scenarios defined around the travels service to experiment with more Circuit Breaker settings, or you can delete the generated Istio config in the service.
Understanding what happened:
(iii) Connection Pool Settings
(iv) Envoy’s Circuit breaking Architecture
Mirroring
This tutorial has shown several scenarios where Istio can route traffic to different versions in order to compare versions and evaluate which one works best.
The Traffic Shifting step was focused on travels service adding a new travels-v2 and travels-v3 workloads and the TCP Traffic Shifting showed how this scenario can be used on TCP services like mysqldb service.
Mirroring (or shadowing) is a particular case of the Traffic Shifting scenario where the proxy sends a copy of live traffic to a mirrored service.
The mirrored traffic happens out of band of the primary request path. It allows for testing of alternate services, in production environments, with minimal risk.
Istio mirrored traffic is only supported for HTTP/gRPC protocols.
This step will show how to apply mirrored traffic into the travels service.
Step 1
Use the Traffic Shifting Wizard on travels serviceWe will simulate the following:
- travels-v1 is the original traffic and it will keep 80% of the traffic
- travels-v2 is the new version to deploy, it’s being evaluated and it will get 20% of the traffic to compare against travels-v1
- But travels-v3 will be considered as a new, experimental version for testing outside of the regular request path. It will be defined as a mirrored workload on 50% of the original requests.

Step 2
Examine Traffic Shifting distribution from the travels-agency GraphNote that Istio does not report mirrored traffic telemetry from the source proxy. It is reported from the destination proxy, although it is not flagged as mirrored, and therefore an edge from travels to the travels-v3 workload will appear in the graph. Note the traffic rates reflect the expected ratio of 80/20 between travels-v1 and travels-v2, with travels-v3 at about half of that total.

This can be examined better using the “Source” and “Destination” metrics from the “Inbound Metrics” tab.
The “Source” proxy, in this case the proxies injected into the workloads of travel-portal namespace, won’t report telemetry for travels-v3 mirrored workload.

But the “Destination” proxy, in this case the proxy injected in the travels-v3 workload, will collect the telemetry from the mirrored traffic.

Step 3
Update or delete Istio ConfigurationAs part of this step you can update the Mirroring scenario to test different mirrored distributions.
When finished you can delete the generated Istio config for the travels service.
4.1.6 - Secure
Authorization Policies and Sidecars
Security is one of the main pillars of Istio features.
The Istio Security High Level Architecture provides a comprehensive solution to design and implement multiple security scenarios.
In this tutorial we will show how Kiali can use telemetry information to create security policies for the workloads deployed in a given namespace.
Istio telemetry aggregates the ServiceAccount information used in the workloads communication. This information can be used to define authorization policies that deny and allow actions on future live traffic communication status.
Additionally, Istio sidecars can be created to limit the hosts with which a given workload can communicate. This improves traffic control, and also reduces the memory footprint of the proxies.
This step will show how we can define authorization policies for the travel-agency namespace, in the Travel Demo application, for all existing traffic in a given time period.
Once authorization policies are defined, a new workload will be rejected if it doesn’t match the security rules defined.
Step 1
Undeploy the loadtester workload from travel-portal namespaceIn this example we will use the loadtester workload as the “intruder” in our security rules.
If we have followed the previous tutorial steps, we need to undeploy it from the system.
kubectl delete -f <(curl -L https://raw.githubusercontent.com/kiali/demos/master/travels/travel_loadtester.yaml) -n travel-portal
We should validate that telemetry has updated the travel-portal namespace and “Security” can be enabled in the Graph Display options.

Step 2
Create Authorization Policies, and Istio Sidecars, for current traffic for travel-agency namespaceEvery workload in the cluster uses a Service Account.
travels.uk, viaggi.it and voyages.fr workloads use the default cluster.local/ns/travel-portal/sa/default ServiceAccount defined automatically per namespace.
This information is propagated into the Istio Telemetry and Kiali can use it to define a set of AuthorizationPolicy rules, and Istio Sidecars.
The Sidecars restrict the list of hosts with which each workload can communicate, based on the current traffic.
The “Create Traffic Policies” action, located in the Overview page, will create these definitions.

This will generate a main DENY ALL rule to protect the whole namespace, and an individual ALLOW rule per workload identified in the telemetry.

It will create also an individual Sidecar per workload, each of them containing the set of hosts.

As an example, we can see that for the travels-v1 workload, the following list of hosts are added to the sidecar.

Step 3
Deploy the loadtester portal in the travel-portal namespaceIf the loadtester workload uses a different ServiceAccount then, when it’s deployed, it won’t comply with the AuthorizationPolicy rules defined in the previous step.
OpenShift
OpenShift users may need to also add the associated loadtester serviceaccount to the necessary securitycontextcontraints.kubectl apply -f <(curl -L https://raw.githubusercontent.com/kiali/demos/master/travels/travel_loadtester.yaml) -n travel-portal
Now, travels workload will reject requests made by loadtester workload and that situation will be reflected in Graph:

This can also be verified in the details page using the Outbound Metrics tab grouped by response code (only the 403 line is present).

Inspecting the Logs tab confirms that loadtester workload is getting a HTTP 403 Forbidden response from travels workloads, as expected.

Step 4
Update travels-v1 AuthorizationPolicy to allow loadtester ServiceAccountAuthorizationPolicy resources are defined per workload using matching selectors.
As part of the example, we can show how a ServiceAccount can be added into an existing rule to allow traffic from loadtester workload into the travels-v1 workload only.

As expected, now we can see that travels-v1 workload accepts requests from all travel-portal namespace workloads, but travels-v2 and travels-v3 continue rejecting requests from loadtester source.

Using “Outbound Metrics” tab from the loadtester workload we can group per “Remote version” and “Response code” to get a detailed view of this AuthorizationPolicy change.

Step 5
Verify the proxies clusters list is limited by the SidecarsAccording to Istio Sidecar documentation, Istio configures all mesh sidecar proxies to reach every mesh workload. After the sidecars are created, the list of hosts is reduced according to the current traffic. To verify this, we can look for the clusters configured in each proxy.
As an example, looking into the cars-v1 workload, we can see that there is a reduced number of clusters with which the proxy can communicate.

Step 6
Update or delete Istio ConfigurationAs part of this step, you can update the AuthorizationPolicies and Istio Sidecars generated for the travel-agency namespace, and experiment with more security rules. Or, you can delete the generated Istio config for the namespace.
4.1.7 - Uninstall Travel Demo
To uninstall the Travel Demo application perform the following commands:
kubectl delete namespace travel-agency
kubectl delete namespace travel-portal
kubectl delete namespace travel-control
5 - Architecture and Terms
5.1 - Architecture
Kiali architecture
Kiali is composed of two components: a back-end application running in the container application platform, and a user-facing front-end application. Kiali depends on external services and components provided by the container application platform and Istio.
The following diagram illustrates the components involved in Kiali and its interactions:
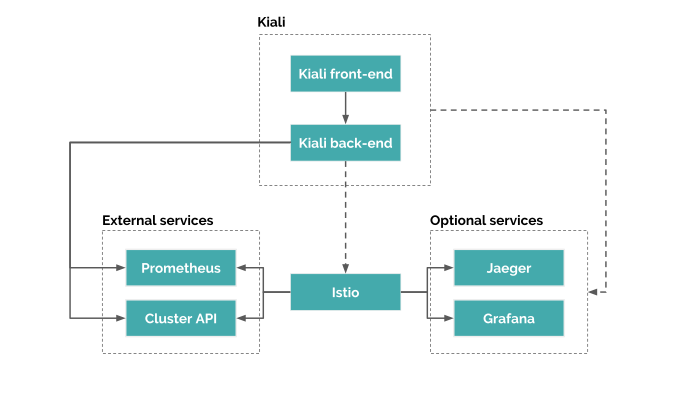
Kiali back-end
The back-end is the application that runs in the container application platform. It’s written in Go. The code can be found at kiali/kiali GitHub repository.
This is the component that communicates with Istio parts, retrieves and processes data, and exposes this data to the front-end.
The back-end doesn’t need storage. The back-end configuration is managed via the Kiali CR when Kiali is installed via the Kiali operator, or via a configmap when installed via Helm.
Kiali front-end
The front-end is a single page web application, built using Patternfly, React, Typescript and Redux. The code can be found at kiali/kiali frontend folder.
In a standard deployment, the back-end serves the front-end. Then, the front-end queries the Kiali back-end in order to get data and present it to the user.
There are limited options for personalization, the front-end is mainly stateless. Some data may be persisted, such as session credentials, but this data is stored in the browser and won’t be available in other browsers nor other devices.
Istio Service Mesh
Kiali is a console for Istio, and as such, Istio is a requirement. It provides and controls the service mesh. Kiali and Istio are installed separately.
Kiali needs to retrieve Istio data and configurations, which are exposed through Prometheus and the cluster API. This is the reason the diagram shows a dashed line: to denote an indirect dependency.
Prometheus
Prometheus is an Istio dependency. When Istio telemetry is enabled, metrics data is stored in Prometheus. Kiali uses the data stored in Prometheus to figure out the mesh topology, show metrics, calculate health, show possible problems, etc.
Kiali communicates directly with Prometheus and assumes the metrics used by Istio Telemetery. It’s a hard dependency for Kiali, and many Kiali features will not work without it.
Currently, Kiali relies on Istio’s default metrics set. Make sure that these default metrics are always in place. Some metric customization is possible as long as the Kiali requirements are still met. For the current list of required metrics see this FAQ entry.
Cluster API
Kiali uses the API of the container application platform (cluster API) in order to fetch and resolve service mesh configurations.
Container application platforms where Kiali is known to work are OKD and Kubernetes. Kiali shoud also work on the derivatives of these platforms. If you want to learn the cluster API, check the OKD REST API reference and the Kubernetes API reference.
Kiali queries the cluster API to retrieve, for example, definitions for namespaces, services, deployments, pods, and other entities. Kiali also makes queries to resolve relationships between the different cluster entities.
The cluster API is also queried to retrieve Istio configurations like virtual services, destination rules, route rules, gateways, and quotas.
Jaeger
Jaeger is optional. When available, Kiali will be able to direct the user to Jaeger’s tracing data. If you need this feature, make sure Kiali is properly configured for Jaeger integration.
Tracing data will be available only if Istio’s distributed tracing is enabled.
Grafana
Grafana is optional. When available, the metrics pages of Kiali will show a link to direct the user to the same metric in Grafana. If you need this feature, make sure Kiali is properly configured for Grafana integration.
Kiali has basic metric capabilities. It can show the default Istio metrics for workloads, apps and services. It allows to apply some groupings to the provided metrics and fetch metrics for different time ranges. However, Kiali doesn’t allow to customize the views nor customize the Prometheus queries. If you need these capabilities, you’ll want to install Grafana. Follow the Istio documentation to install Grafana if you need it.
5.2 - Terminology
5.2.1 - Concepts
Application
Is a logical grouping of Workloads defined by the application labels that users apply to an object. In Istio it is defined by the Label App. See Istio Label Requirements.
Application Name
It’s the name of the Application deployed in your environment. This name is provided by the Label App on the Workload.
Envoy
A proxy that Istio starts for each pod in the service mesh. For more information see the Istio Envoy Documentation.
Envoy Health
A health check performed by Envoy proxies, for inbound and outbound traffic: see membership_healthy and membership_total from Envoy documentation.
Istio object/configuration Type
This is the type specified in the Istio Config. This could be any of the following types: Gateway, Virtual Service, DestinationRule, ServiceEntry, Rule, Quota or QuotaSpecBinding.
Istio Sidecar
For more information see the Istio Sidecar definition in Istio Sidecar Documentation.
Label
It’s a user-created tag to identify a set of objects.
An empty label selector (that is, one with zero requirements) selects every object in the collection.
A null label selector (which is only possible for optional selector fields) selects no objects.
For example, Istio uses the Label App & Label Version on a Workload to specify the version and the application.
Label App
This is the ‘app’ label on an object. For more information, see Istio Label Requirements.
Label Version
This is the ‘version’ label on an object. For more information, see Istio Label Requirements.
Namespace
Namespaces are intended for use in environments with many users spread across multiple teams, or projects.
Namespaces are a way to divide cluster resources between multiple users.
Quota
A limited or fixed number or amount of resources.
ReplicaSet
Ensures that a specified number of pod replicas are running at any one time.
Service
A Service is an abstraction which defines a logical set of Pods and a policy by which to access them. A Service is determined by a Label.
Service Entry
For more information see the Service Entry definition in Istio Service Entry Documentation.
Virtual Service
For more information see the Virtual Service definition in Istio VirtualService Documentation.
Workload
For more information see the Istio Workload definition.
5.2.2 - Networking
Destination
For more information see the Destination definition in the Istio Glossary.
Destination Rule
For more information see the Istio Destination Rule Documentation.
Endpoint
A communication endpoint is a type of communication network node. It is an interface exposed by a communicating party or by a communication channel.
Error Rate
It’s the percentage of errors in the traffic to a specific object for a Rate Interval.
Gateway
For more information see the Gateway definition in the Istio Gateway Documentation.
Inbound Metrics
Metrics on requests received by a given Workload, Service or Application.
Outbound Metrics
Metrics on requests emitted by a given Workload or Application.
Port
For more information see the Istio Port Documentation.
Rate Interval
It’s an amount of time. By Default in Kiali last 10 minutes.
Rule
It’s an object that manages external access to the services in a cluster, typically HTTP.
Source
For more information see the Source definition in the Istio Glossary.
Subset
For more information see the Istio Subset Documentation.
6 - FAQ
6.1 - Authentication
How to obtain a token when logging in via token auth strategy
When configuring Kiali to use the token auth strategy, it requires users to log into Kiali as a specific user via the user’s service account token. Thus, in order to log into Kiali you must provide a valid Kubernetes token.
You can extract a service account’s token from the secret that was created for you when you created the service account.
For example, if you want to log into Kiali using Kiali’s own service account, you can get the token like this:
kubectl get secret -n istio-system $(kubectl get sa kiali-service-account -n istio-system -o "jsonpath={.secrets[0].name}") -o jsonpath={.data.token} | base64 -d
Note that this example assumes you installed Kiali in the istio-system namespace.
Once you obtain the token, you can go to the Kiali login page and copy-and-paste that token into the token field. At this point, you have logged into Kiali with the same permissions as that of the Kiali server itself (note: this gives the user the permission to see everything).
Create different service accounts with different permissions for your users to use. Each user should only have access to their own service accounts and tokens.
How to configure the originating port when Kiali is served behind a proxy (OpenID support)
When using OpenID strategy for authentication and deploying Kiali behind a reverse proxy or a load balancer, Kiali needs to know the originating port of client requests. You may need to setup your proxy to inject a X-Forwarded-Port HTTP header when forwarding the request to Kiali.
For example, when using an Istio Gateway and VirtualService to expose Kiali, you could use the headers property of the route:
spec:
  gateways:
  - istio-ingressgateway.istio-system.svc.cluster.local
  hosts:
  - kiali.abccorp.net
  http:
  - headers:
      request:
        set:
          X-Forwarded-Port: "443"
    route:
    - destination:
        host: kiali
        port:
          number: 20001
6.2 - Distributed Tracing
Why is Jaeger unreachable or Kiali showing the error “Could not fetch traces”?
Istio components status indicator shows “Jaeger unreachable”:
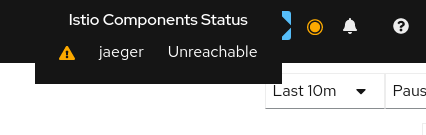
While on any Tracing page, error “Could not fetch traces” is displayed:
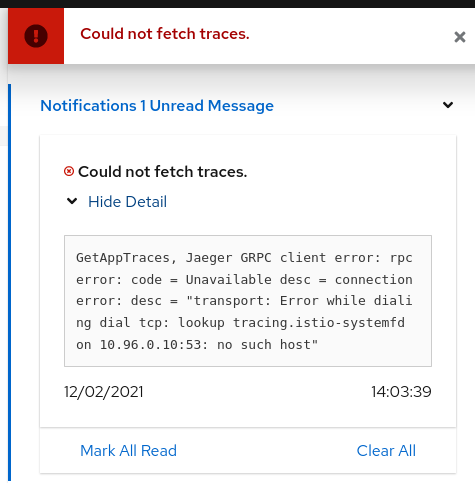
Apparently, Kiali is unable to connect to Jaeger. Make sure tracing is correctly configured in the Kiali CR.
      tracing:
        auth:
          type: none
        enabled: true
        in_cluster_url: 'http://tracing.istio-system/jaeger'
        url: 'http://jaeger.example.com/'
        use_grpc: true
You need especially to pay attention to the in_cluster_url field, which is how Kiali backend contacts the Jaeger service. In general, this URL is written using Kubernetes domain names in the form of http://service.namespace, plus a path.
If you’re not sure about this URL, try to find your Jaeger service and its exposed ports:
$ kubectl get services -n istio-system
...
tracing      ClusterIP      10.108.216.102   <none>        80/TCP      47m
...
To validate this URL, you can try to curl its API via Kiali pod, by appending /api/traces to the configured URL (in the following, replace with the appropriate Kiali pod):
$ kubectl exec -n istio-system -it kiali-556fdb8ff5-p6l2n -- curl http://tracing.istio-system/jaeger/api/traces

{"data":null,"total":0,"limit":0,"offset":0,"errors":[{"code":400,"msg":"parameter 'service' is required"}]}
If you see some returning JSON as in the above example, that should be the URL that you must configure.
If instead of that you see some blocks of mixed HTML/Javascript mentioning JaegerUI, then probably the host+port are correct but the path isn’t.
A common mistake is to forget the /jaeger suffix, which is often used in Jaeger deployments.
It may also happen that you have a service named jaeger-query, exposing port 16686, instead of the more common tracing service on port 80. In that situation, set in_cluster_url to http://jaeger-query.istio-system:16686/jaeger.
If Jaeger needs an authentication, make sure to correctly configure the auth section.
Note that in general, Kiali will connect to Jaeger via GRPC, which provides better performances. If for some reason it cannot be done (e.g. Jaeger being behind a reverse-proxy that doesn’t support GRPC, or that needs more configuration in that purpose), it is possible to switch back to using the http/json API of Jaeger by setting use_grpc to false.
If for some reason the GRPC connection fails and you think it shouldn’t (e.g. your reverse-proxy supports it, and the non-grpc config works fine), please get in touch with us.
Why can’t I see any external link to Jaeger?
In addition to the embedded integration that Kiali provides with Jaeger, it is possible to show external links to the Jaeger UI. To do so, the external URL must be configured in the Kiali CR.
    tracing:
      # ...
      url: "http://jaeger.example.com/"
When configured, this URL will be used to generate a couple of links to Jaeger within Kiali. It’s also visible in the About modal:
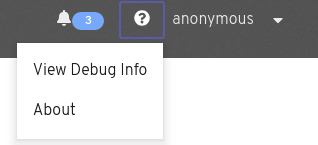
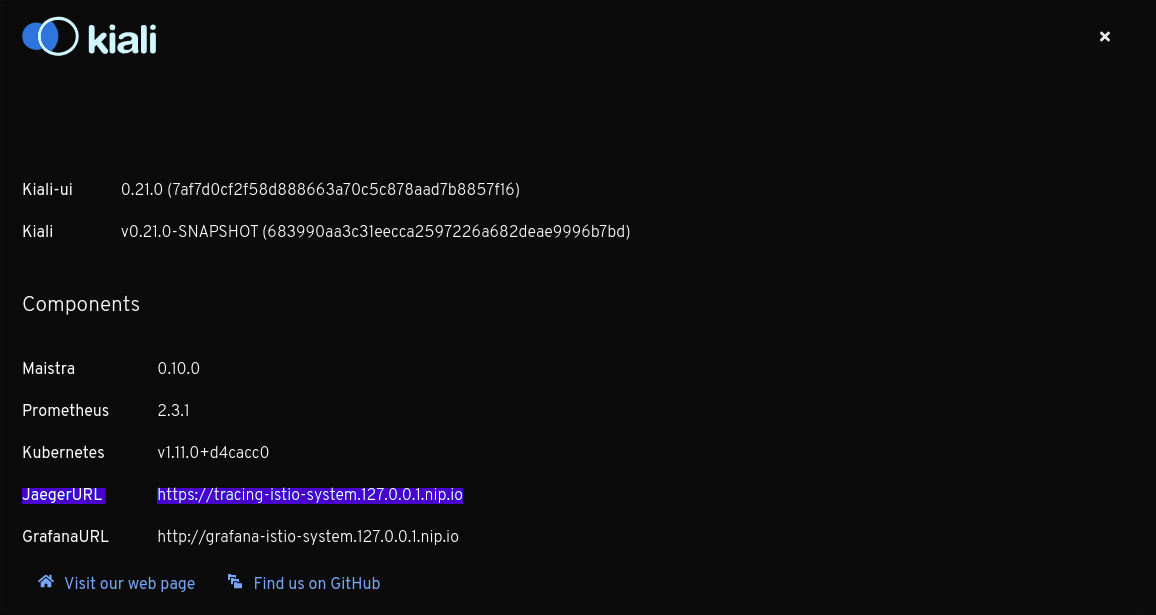
Why do I see an external link instead of Kiali’s own Tracing page?
On the Application detail page, the Traces tab might redirect to Jaeger via an external link instead of showing the Kiali Tracing view. It happens when you have the url field configured, but not in_cluster_url, which means the Kiali backend will not be able to connect to Jaeger.
To fix it, configure in_cluster_url in the Kiali CR.
Why do I see “Missing root span” for the root span of some span details on Traces tab?
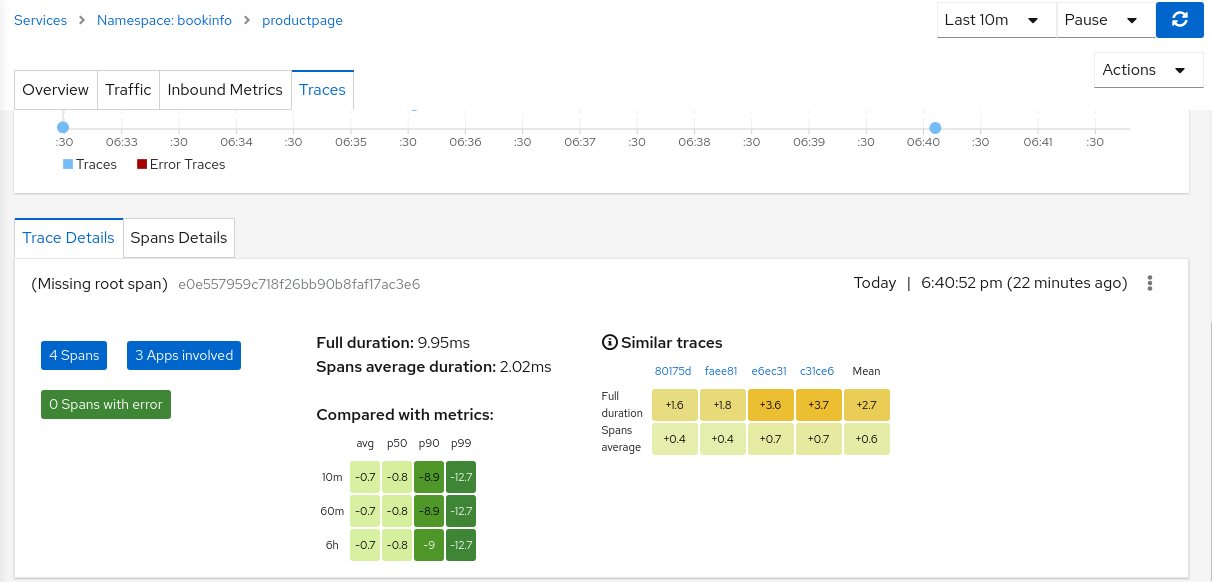
In Traces tab, while clicking on a trace, it shows the details of that trace and information about spans. These details also include the root span information. But for the traces for traffic that is not comming from ingress-gateway, the root span information is not available in Jaeger, thus Kiali is displaying “Missing root span” for those traces' details and tooltips in Traces tab and in Graph pages.
6.3 - General
Why is the Workload or Application Detail page so slow or not responding?
We have identified a performance issue that happens while visiting the Workload or Application detail page, related to discovering metrics in order to show custom dashboards. Both Kiali and Prometheus may run out of memory.
The immediate workaround is to disable dashboards discovery:
spec:
  external_services:
    custom_dashboards:
      discovery_enabled: "false"
It’s also recommended to consider a more robust setup for Prometheus, like the one described in this Istio guide (see also this Kiali blog post), in order to decrease the metrics cardinality.
What do I need to run Kiali in a private cluster?
Private clusters have higher network restrictions. Kiali needs your cluster to allow TCP traffic between the Kubernetes API service and the Istio Control Plane namespace, for both the 8080 and 15000 ports. This is required for features such as Health and Envoy Dump to work as expected.
Make sure that the firewalls in your cluster allow the connections mentioned above.
Check section Google Kubernetes Engine (GKE) Private Cluster requirements in the Installation Guide.
Does Kiali support Internet Explorer?
No version of Internet Explorer is supported with Kiali. Users may experience some issues when using Kiali through this browser.
Kiali does not work - What do i do?
If you are hitting a problem, whether it is listed here or not, do not hesitate to open a GitHub Discussion to ask about your situation. If you are hitting a bug, or need a feature, you can vote (using emojis) for any existing bug or feature request found in the GitHub Issues. This will help us prioritize the most needed fixes or enhancements. You can also create a new issue.
See also the Community page which lists more contact channels.
How do I obtain the logs for Kiali?
Kiali operator logs can be obtained from within the Kiali operator pod. For example, if the operator is installed in the kiali-operator namespace:
KIALI_OPERATOR_NAMESPACE="kiali-operator"
kubectl logs -n ${KIALI_OPERATOR_NAMESPACE} $(kubectl get pod -l app=kiali-operator -n ${KIALI_OPERATOR_NAMESPACE} -o name)
Kiali server logs can be obtained from within the Kiali server pod. For example, if the Kiali server is installed in the istio-system namespace:
KIALI_SERVER_NAMESPACE="istio-system"
kubectl logs -n ${KIALI_SERVER_NAMESPACE} $(kubectl get pod -l app=kiali -n ${KIALI_SERVER_NAMESPACE} -o name)
Note that you can configure the logger in the Kiali Server.
Which Istio metrics and attributes are required by Kiali?
To reduce Prometheus storage some users want to customize the metrics generated by Istio. This can break Kiali if the pruned metrics and/or attributes are used by Kiali in its graph or metric features.
Kiali currently requires the following Istio metrics and attributes:
| Metric | Notes |
|---|---|
| istio_requests_total | used throughout Kiali and the primary metric for http/grpc request traffic |
| istio_request_bytes_bucket | used in metric displays to calculate throughput percentiles |
| istio_request_bytes_count | used in metric displays to calculate throughput avg |
| istio_request_bytes_sum | used throughout Kiali for throughput calculation |
| istio_request_duration_milliseconds_bucket | used throughout Kiali for response-time calculation |
| istio_request_duration_milliseconds_count | used throughout Kiali for response-time calculation |
| istio_request_duration_milliseconds_sum | used throughout Kiali for response-time calculation |
| istio_request_messages_total | used throughout Kiali for grpc sent message traffic |
| istio_response_bytes_bucket | used in metric displays to calculate throughput percentiles |
| istio_response_bytes_count | used in metric displays to calculate throughput avg |
| istio_response_bytes_sum | used throughout Kiali for throughput calculation |
| istio_response_messages_total | used throughout Kiali for grpc received message traffic |
| istio_tcp_connections_closed_total | used in metric displays |
| istio_tcp_connections_opened_total | used in metric displays |
| istio_tcp_received_bytes_total | used throughout Kiali for tcp received traffic |
| istio_tcp_sent_bytes_total | used throughout Kiali for tcp sent traffic |
| Attribute | Metric | Notes |
|---|---|---|
| connection_security_policy | istio_requests_total | used only when graph Security display option is enabled |
| destination_canonical_revision | all | |
| destination_canonical_service | all | |
| destination_cluster | all | |
| destination_principal | istio_requests_total | used only when graph Security display option is enabled |
| istio_request_messages_total | ||
| istio_response_messages_total | ||
| istio_tcp_received_bytes_total | ||
| istio_tcp_sent_bytes_total | ||
| destination_service | all | |
| destination_service_name | all | |
| destination_service_namespace | all | |
| destination_workload | all | |
| destination_workload_namespace | all | |
| grpc_response_status | istio_requests_total | used only when request_protocol=“grpc” |
| istio_request_bytes_sum | ||
| istio_request_duration_milliseconds_bucket | ||
| istio_request_duration_milliseconds_sum | ||
| istio_response_bytes_sum | ||
| reporter | all | both “source” and “destination” metrics are used by Kiali |
| request_operation | istio_requests_total | used only when request classification is configured. “request_operation” is the default attribute, it is configurable. |
| istio_request_bytes_sum | ||
| istio_response_bytes_sum | ||
| request_protocol | istio_requests_total | |
| istio_request_bytes_sum | ||
| istio_response_bytes_sum | ||
| response_code | istio_requests_total | |
| istio_request_bytes_sum | ||
| istio_request_duration_milliseconds_bucket | ||
| istio_request_duration_milliseconds_sum | ||
| istio_response_bytes_sum | ||
| response_flags | istio_requests_total | |
| istio_request_bytes_sum | ||
| istio_request_duration_milliseconds_bucket | ||
| istio_request_duration_milliseconds_sum | ||
| istio_response_bytes_sum | ||
| source_canonical_revision | all | |
| source_canonical_service | all | |
| source_cluster | all | |
| source_principal | istio_requests_total | |
| istio_request_messages_total | ||
| istio_response_messages_total | ||
| istio_tcp_received_bytes_total | ||
| istio_tcp_sent_bytes_total | ||
| source_workload | all | |
| source_workload_namespace | all |
Kiali currently requires the following Envoy metrics:
| Metric | Notes |
|---|---|
| envoy_cluster_upstream_cx_active | used in workload details |
| envoy_cluster_upstream_rq_total | used in workload details |
| envoy_listener_downstream_cx_active | used in workload details |
| envoy_listener_http_downstream_rq | used in workload details |
| envoy_server_memory_allocated | used in workload details |
| envoy_server_memory_heap_size | used in workload details |
| envoy_server_uptime | used in workload details |
What is the License?
See here for the Kiali license.
Why isn’t my namespace in the Namespace Selection dropdown?
When deploying Kiali with the Kiali operator, by default some namespaces are excluded from the list of namespaces provided by the API and UI. Kiali filters out these namespaces and you will not see them in the Namespace Selection dropdown. You can adjust which namespaces are excluded by setting the spec.api.namespaces.exclude field on the Kiali CR.
In addition, you must ensure that Kiali has access to the namespaces you are interested in by setting the spec.deployment.accessible_namespaces field on the Kiali CR accordingly. Setting spec.api.namespaces.exclude alone does not give Kiali access to the namespaces. See the Namespace Management guide for more information.
Kiali also caches namespaces by default for 10 seconds. If the cache is enabled, it might take up to the spec.kubernetes_config.cache_token_namespace_duration in order for a newly added namespace to be seen by Kiali.
Workload “is not found as” messages
Kiali queries Deployment ,ReplicaSet, ReplicationController, DeploymentConfig, StatefulSet, Job and CronJob controllers. Deployment, ReplicaSet and StatefulSet are always queried, but ReplicationController, DeploymentConfig, Job and CronJobs are excluded by default for performance reasons.
To include them, update the list of excluded_workloads from the Kiali config.
#    ---
#    excluded_workloads:
#    - "CronJob"
#    - "DeploymentConfig"
#    - "Job"
#    - "ReplicationController"
#
An empty list will tell Kiali to query all type of known controllers.
Why Health is not available for services using TCP protocol?
Health for Services is calculated based on success rate of traffic. The traffic of HTTP and GRPC protocols is request based and it is possible to inspect each request to check and extract response codes to determine how many requests succeeded and how many erred.
However, HTTP is a widely known protocol. Applications may use other less known protocols to communicate. For these cases, Istio logs the traffic as raw TCP (an opaque sequence of bytes) and is not analyzed. Thus, for Kiali it is not possible to know if any traffic have failed or succeeded and reports Health as unavailable.
6.4 - Graph
Why is my graph empty?
There are several reasons why a graph may be empty. First, make sure you have selected at least one namespace. Kiali will look for traffic into, out of, and within the selected namespaces. Another reason is that Istio is not actually generating the expected telemetry. This is typically an indication that workload pods have not been injected with the Istio sidecar proxy (Envoy proxy). But it can also mean that there is an issue with Prometheus configuration, and it is not scraping metrics as expected. To verify that telemetry is being reported to Prometheus, see this FAQ entry.
The primary reason a graph is empty is just that there is no measurable request traffic for the selected namespaces, for the selected time period. Note that to generate a request rate, at least two requests must be recorded, and that Kiali only records request rates >= .01 request-per-minute. Check your selection in the Duration dropdown, if it is small, like 1m, you may need to increase the time period to 5m or higher.
You can enable the “Idle Edges” Display option to include request edges that previously had traffic, but not during the requested time period. This is disabled by default to present a cleaner graph, but can be enabled to get a full picture of current and previous traffic.
Older versions of Kiali may show an empty graph for shorter duration options, depending on the Prometheus globalScrapeInterval configuration setting. For more, see this FAQ entry.
Why is my Duration dropdown menu missing entries?
The Duration menu for the graph, and also other pages, does not display invalid options based on the Prometheus configuration. Options greater than the tsdbRetentionTime do not make sense. For example, if Prometheus stores 7 days of metrics then Kiali will not show Duration options greater than 7 days.
More recently, Kiali also considers globalScrapeInterval. Because request-rate calculation requires a minimum of two data-points, Duration options less than 2 times the globalScrapeInterval will not be shown. For example, if Prometheus scrapes every 1m, the 1m Duration option will not be shown. Note that the default globalScrapeInterval for Helm installs of Prometheus is 1m (at the time of this writing).
Why are my TCP requests disconnected in the graph?
Some users are surprised when requests are not connected in the graph. This is normal Istio telemetry for TCP requests if mTLS is not enabled. For HTTP requests, the requests will be connected even without MTLS, because Istio uses headers to exchange workload metadata between source and destination. With the disconnected telemetry you will see an edge from a workload to a terminal service node. That’s the first hop. And then another edge from “Unknown” to the expected destination service/workload. In the graph below, this can be seen for the requests from myapp to redis and mongodb:
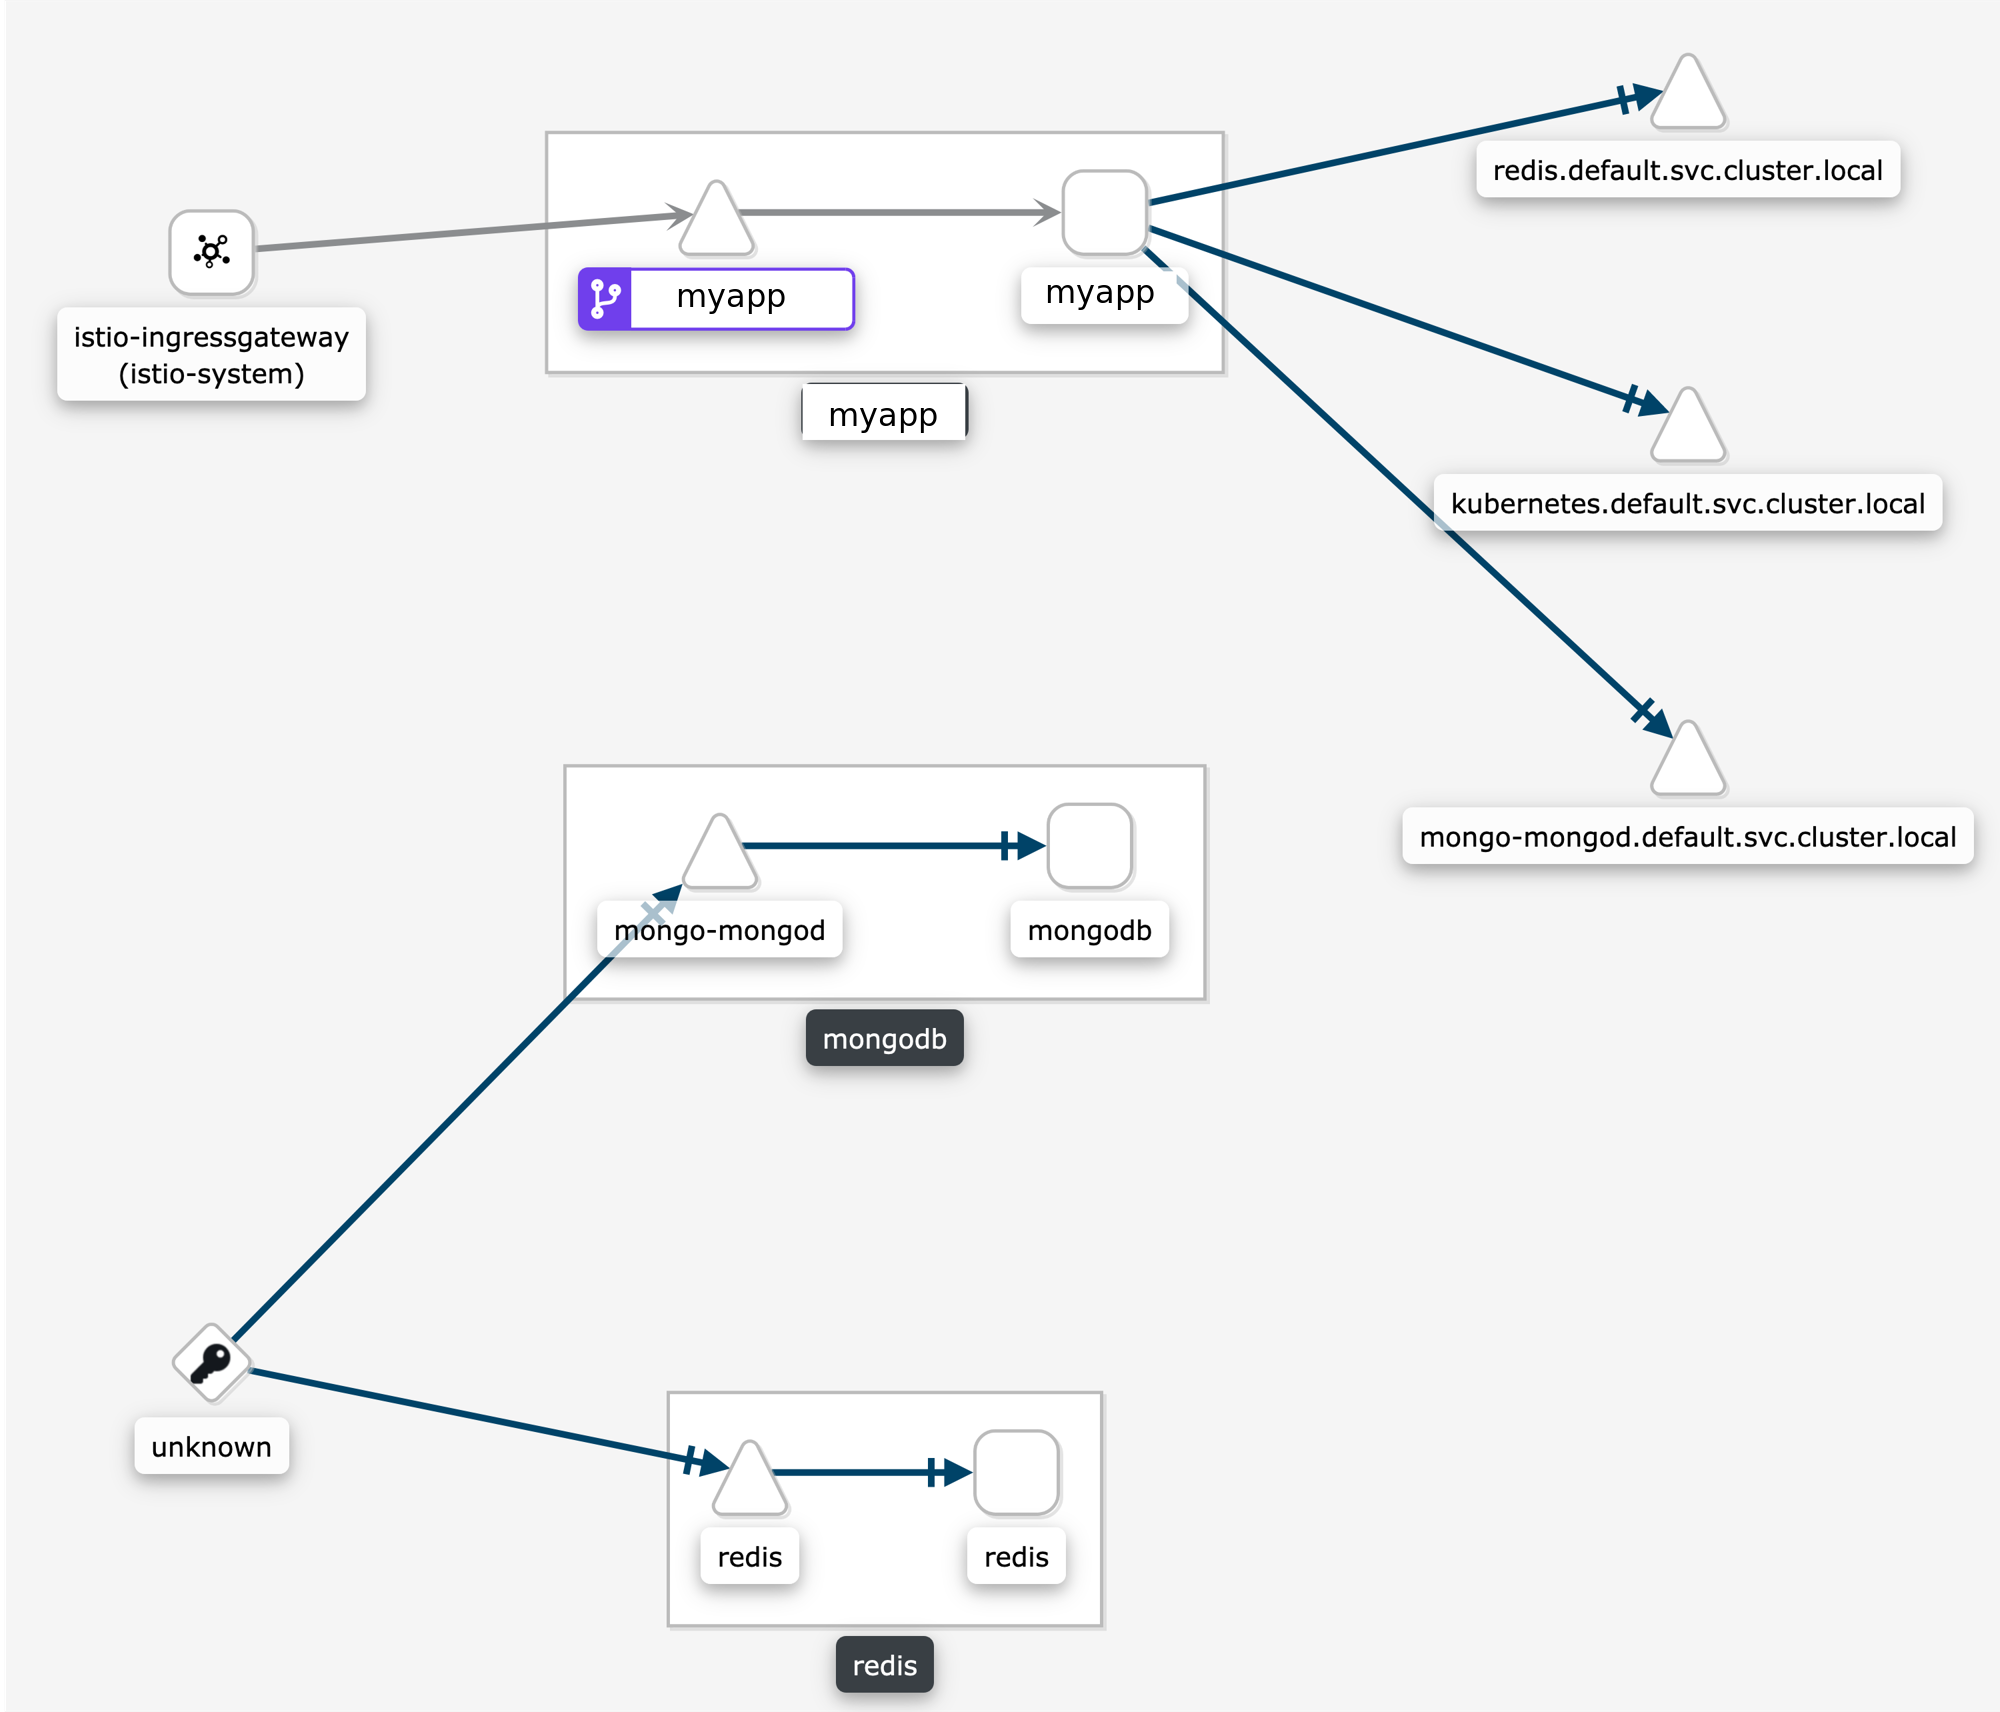
Why is my external HTTPS traffic showing as TCP?
Istio can’t recognize HTTPS request that go directly to the service, the reason is that these requests are encrypted and are recognized as TCP traffic.
You can however configure your mesh to use TLS origination for your egress traffic. This will allow to see your traffic as HTTP instead of TCP.
Why is the graph badly laid out?
The layout for Kiali Graph may render differently, depending on the data to display (number of graph nodes and their interactions) and it’s sometimes difficult, not to say impossible, to have a single layout that renders nicely in every situation. That’s why Kiali offers a choice of several layout algorithms. However, we may still find some scenarios where none of the proposed algorithms offer a satisfying display. If Kiali doesn’t render your graph layout in a satisfactory manner please switch to another layout option. This can be done from the Graph Toolbar located on the bottom left of the graph. Note that you can select different layouts for the whole graph, and for inside the namespace boxes.
If Kiali doesn’t produce a good graph for you, don’t hesitate to open an issue in GitHub or reach out via the usual channels.
Why are there many unknown nodes in the graph?
In some situations you can see a lot of connections from an “Unknown” node to your services in the graph, because some software external to your mesh might be periodically pinging or fetching data. This is typically the case when you setup Kubernetes liveness probes, or have some application metrics pushed or exposed to a monitoring system such as Prometheus. Perhaps you wouldn’t like to see these connections because they make the graph harder to read.
From the Graph page, you can filter them out by typing node = unknown in the Graph Hide input box.

For a more definitive solution, you could have these endpoints (like /health or /metrics) exposed on a different port and server than your main application, and to not declare this port in your Pod’s container definition as containerPort. This way, the requests will be completely ignored by the Istio proxy, as mentioned in Istio documentation (at the bottom of that page).
Why do I have missing edges?
Kiali builds the graph from Istio’s telemetry. If you don’t see what you expect it probably means that it has not been reported in Prometheus. This usually means that:
1- The requests are not actually sent.
2- Sidecars are missing.
3- Requests are leaving the mesh and are not configured for telemetry.
For example, If you don’t see traffic going from node A to node B, but you are sure there is traffic, the first thing you should be doing is checking the telemetry by querying the metrics, for example, if you know that MyWorkload-v1 is sending requests to ServiceA try looking for metrics of the type:
istio_requests_total{destination_service="ServiceA"}
If telemetry is missing then it may be better to take it up with Istio.
Which lock icons should I see when I enable the Kiali Graph Security Display option?
Sometimes the Kiali Graph Security Display option causes confusion. The option is disabled by default for optimal performance, but enabling the option typically adds nominal time to the graph rendering. When enabled, Kiali will determine the percentage of mutual TLS (mTLS) traffic on each edge. Kiali will only show lock icons on edges with traffic for edges that have > 0% mTLS traffic.
Kiali determines the mTLS percentage for the edges via the connection_security_policy attribute in the
Prometheus telemetry. Note that this is destination telemetry (i.e. reporter="destination").
Why can’t I see traffic leaving the mesh?
See Why do I have missing edges?, and additionally consider whether you need to create a ServiceEntry (or several) to allow the requests to be mapped correctly.
You can check this article on how to visualize your external traffic in Kiali for more information.
Why do I see traffic to PassthroughCluster?
Requests going to PassthroughCluster (or BlackHoleCluster) are requests that did not get routed to a defined service or service entry, and instead end up at one of these built-in Istio request handlers. See Monitoring Blocked and Passthrough External Service Traffic for more information.
Unexpected routing to these nodes does not indicate a Kiali problem, you’re seeing the actual routing being performed by Istio. In general it is due to a misconfiguration and/or missing Istio sidecar. Less often but possible is an actual issue with the mesh, like a sync issue or evicted pod.
Use Kiali’s Workloads list view to ensure sidecars are not missing. Use Kiali’s Istio Config list view to look for any config validation errors.
How do I inspect the underlying metrics used to generate the Kiali Graph?
It is not uncommon for the Kiali graph to show traffic that surprises the user. Often the thought is that Kiali may have a bug. But in general Kiali is just visualizing the metrics generated by Istio. The next thought is that the Istio telemetry generation may have a bug. But in general Istio is generating the expected metrics given the defined configuration for the application.
To determine whether there is an actual bug it can be useful to look directly at the metrics collected by and stored in the Prometheus database. Prometheus provides a basic console that can be opened using the istioctl dashboard command:
> istioctl dashboard prometheus
The above command, assuming Istio and Prometheus are in the default istio-system namespace, should open the Prometheus console in your browser.
Kiali uses a variety of metrics but the primary request traffic metrics for graph generation are these:
- istio_requests_total
- istio_tcp_sent_bytes_total
The Prometheus query language is very rich but a few basic queries is often enough to gather time-series of interest.
Here is a query that returns time-series for HTTP or GRPC requests to the reviews service in Istio’s BookInfo sample demo:
istio_requests_total{reporter="source", destination_service_name="reviews"}
And here is an example of the results:
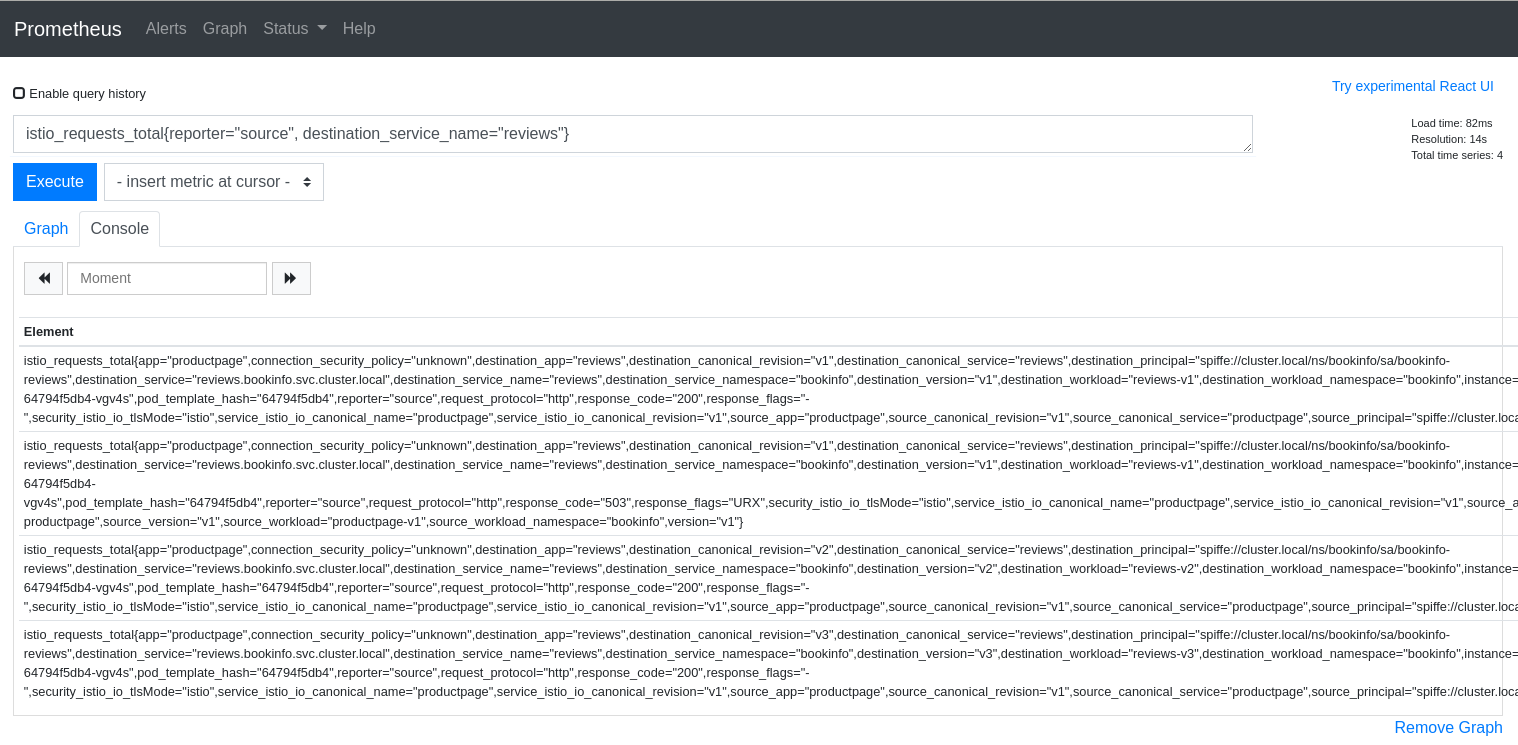
The query above is good for dumping all of the attributes but it can be useful to aggregate results by desired attributes. The next query will get the request counts for the reviews service broken down by source and destination workloads:
sum(istio_requests_total{reporter="source", destination_service_name="reviews"}) by (source_workload, destination_workload)
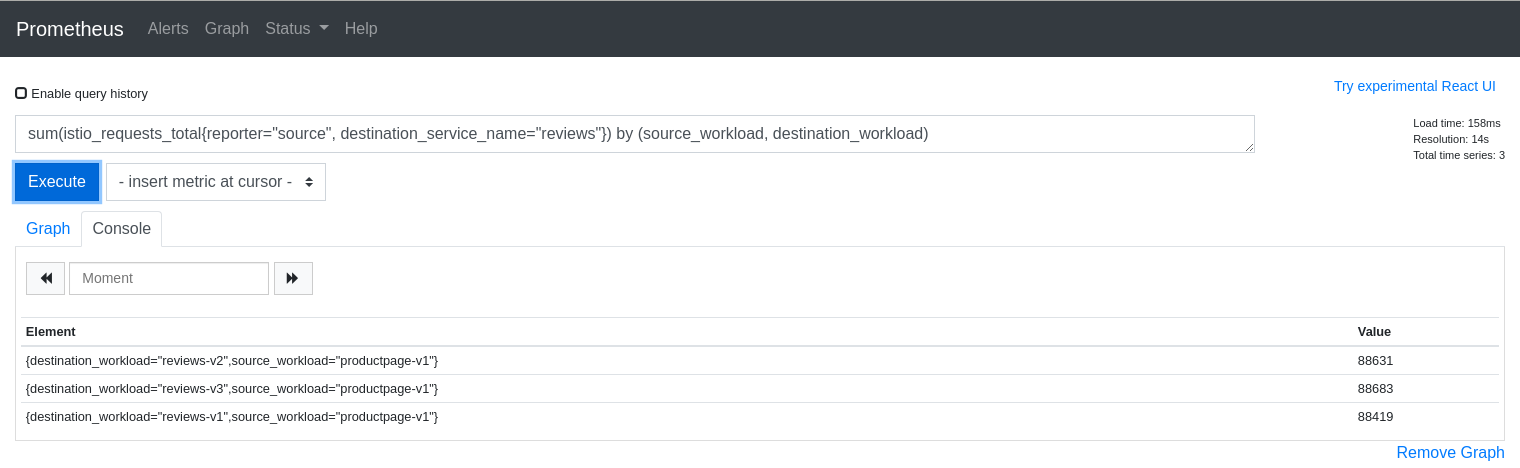
The first step to explaining your Kiali graph is to inspect the metrics used to generate the graph. Kiali devs may ask for this info when working with you to solve a problem, so it is useful to know how to get to the Prometheus console.
Why don’t I see response times on my service graph?
Users can select Response Time to label their edges with 95th percentile response times. The response time indicates the amount of time it took for the destination workload to handle the request. In the Kiali graph the edges leading to service nodes represent the request itself, in other words, the routing. Kiali can show the request rate for a service but response time is not applicable to be shown on the incoming edge. Only edges to app, workload, or service entry nodes show response time because only those nodes represent the actual work done to handle the request. This is why a Service graph will typically not show any response time information, even when the Response Time option is selected.
Because Service graphs can show Service Entry nodes the Response Time option is still a valid choice. Edges to Service Entry nodes represent externally handled requests, which do report the response time for the external handling.
Why does my workload graph show service nodes?
Even when Display Service Nodes is disabled a workload graph can show service nodes. Display Service Nodes ensures that you will see the service nodes between two other nodes,
providing an edge to the destination service node, and a subsequent edge to the node handling the request. This option injects service nodes where they previously would not be
shown. But Kiali will always show a terminal service node when the request itself fails to be routed to a destination workload. This ensures the graph visualizes problem areas.
This can happen in a workload or app graph. Of course in a service graph the Display Service Nodes option is simply ignored.
6.5 - Installation
Operator fails due to cannot list resource "clusterroles" error
When the Kiali Operator installs a Kiali Server, the Operator will assign the Kiali Server the proper roles/rolebindings so the Kiali Server can access the appropriate namespaces.
The Kiali Operator will check to see if the Kiali CR setting deployment.accessible_namespaces has a value of ['**']. If it does, this means the Kiali Server is to
be given access to all namespaces in the cluster, including namespaces that will be created in the future. In this case, the Kiali Operator will create and assign
ClusterRole/ClusterRoleBinding resources to the Kiali Server. But in order to do this, the Kiali Operator must itself be given permission to create those ClusterRole
and ClusterRoleBinding resources. When you install the Kiali Operator via OLM, these permissions are automatically granted. However, if you installed the Kiali Operator
with the Operator Helm Chart, and if you did so with the value clusterRoleCreator
set to false then the Kiali Operator will not be given permission to create cluster roles. In this case, you will be unable to install a Kiali Server if your Kiali
CR has deployment.accessible_namespaces set to ['**'] - you will get an error similar to this:
Failed to list rbac.authorization.k8s.io/v1, Kind=ClusterRole:
clusterroles.rbac.authorization.k8s.io is forbidden:
User "system:serviceaccount:kiali-operator:kiali-operator"
cannot list resource "clusterroles" in API group
"rbac.authorization.k8s.io" at the cluster scope
Thus, if you do not give the Kiali Operator the permission to create cluster roles, you must tell the Operator which specific namespaces the Kiali Server can
access (you cannot use [**']). When specific namespaces are specified in deployment.accessible_namespaces, the Kiali Operator will create Role
and RoleBindings (not the “Cluster” kinds) and assign them to the Kiali Server.
What values can be set in the Kiali CR?
A Kiali CR is used to tell the Kiali Operator how and where to install a Kiali Server in your cluster. You can install one or more Kiali Servers by creating one Kiali CR for each Kiali Server you want the Operator to install and manage. Deleting a Kiali CR will uninstall its associted Kiali Server.
Most options are described in the pages of the Installation and Configuration sections of the documentation.
If you cannot find some configuration, check the Kiali CR Reference, which briefly describes all available options along with an example CR and all default values. If you are using a specific version of the Operator prior to 1.46, the Kiali CR that is valid for that version can be found in the version tag within the github repository (e.g. Operator v1.25.0 supported these Kiali CR settings).
How to configure some operator features at runtime
Once the Kiali Operator is installed, you can change some of its configuration at runtime in order to utilize certain features that the Kiali Operator provides. These features are configured via environment variables defined in the operator’s deployment.
Perform the following steps to configure these features in the Kiali Operator:
- Determine the namespace where your operator is located and store that namespace name in
$OPERATOR_NAMESPACE. If you installed the operator via helm, it may bekiali-operator. If you installed the operator via OLM, it may beopenshift-operators. If you are not sure, you can perform a query to find it:
OPERATOR_NAMESPACE="$(kubectl get deployments --all-namespaces | grep kiali-operator | cut -d ' ' -f 1)"
- Determine the name of the environment variable you need to change in order to configure the feature you are interested in. Here is a list of currently supported environment variables you can set:
ALLOW_AD_HOC_KIALI_NAMESPACE: must betrueorfalse. Iftrue, the operator will be allowed to install the Kiali Server in any namespace, regardless of which namespace the Kiali CR is created. Iffalse, the operator will only install the Kiali Server in the same namespace where the Kiali CR is created - any attempt to do otherwise will cause the operator to abort the Kiali Server installation.ALLOW_AD_HOC_KIALI_IMAGE: must betrueorfalse. Iftrue, the operator will be allowed to install the Kiali Server with a custom container image as defined in the Kiali CR’sspec.deployment.image_nameand/orspec.deployment.image_version. Iffalse, the operator will only install the Kiali Server with the default image. If a Kiali CR is created withspec.deployment.image_nameorspec.deployment.image_versiondefined, the operator will abort the Kiali Server installation.ANSIBLE_DEBUG_LOGS: must betrueorfalse. Whentrue, turns on debug logging within the Operator SDK. For details, see the docs here.ANSIBLE_VERBOSITY_KIALI_KIALI_IO: Controls how verbose the operator logs are - the higher the value the more output is logged. For details, see the docs here.ANSIBLE_CONFIG: must be/etc/ansible/ansible.cfgor/opt/ansible/ansible-profiler.cfg. If set to/opt/ansible/ansible-profiler.cfga profiler report will be dumped in the operator logs after each reconciliation run.
- Store the name of the environment variable you want to change in
$ENV_NAME:
ENV_NAME="ANSIBLE_CONFIG"
- Store the new value of the environment variable in
$ENV_VALUE:
ENV_VALUE="/opt/ansible/ansible-profiler.cfg"
- The final step depends on how you installed the Kiali Operator:
oc. If you are using a non-OpenShift Kubernetes environment, simply substitute all the oc references to kubectl.
- If you installed the operator via helm, simply set the environment variable on the operator deployment directly:
oc -n ${OPERATOR_NAMESPACE} set env deploy/kiali-operator "${ENV_NAME}=${ENV_VALUE}"
- If you installed the operator via OLM, you must set this environment variable within the operator’s CSV and let OLM propagate the new environment variable value down to the operator deployment:
oc -n ${OPERATOR_NAMESPACE} patch $(oc -n ${OPERATOR_NAMESPACE} get csv -o name | grep kiali) --type=json -p "[{'op':'replace','path':"/spec/install/spec/deployments/0/spec/template/spec/containers/0/env/$(oc -n ${OPERATOR_NAMESPACE} get $(oc -n ${OPERATOR_NAMESPACE} get csv -o name | grep kiali) -o jsonpath='{.spec.install.spec.deployments[0].spec.template.spec.containers[0].env[*].name}' | tr ' ' '\n' | cat --number | grep ${ENV_NAME} | cut -f 1 | xargs echo -n | cat - <(echo "-1") | bc)/value",'value':"\"${ENV_VALUE}\""}]"
How can I inject an Istio sidecar in the Kiali pod?
By default, Kiali will not have an Istio sidecar. If you wish to deploy the Kiali pod with a sidecar,
you have to define the sidecar.istio.io/inject=true label in the spec.deployment.pod_labels setting in the Kiali CR. For example:
spec:
  deployment:
    pod_labels:
      sidecar.istio.io/inject: "true"
If you are utilizing CNI in your Istio environment (for example, on OpenShift), Istio will not allow sidecars to work when injected in pods deployed in the control plane namespace, e.g. istio-system. (1) (2) (3). In this case, you must deploy Kiali in its own separate namespace. On OpenShift, you can do this using the following instructions.
Determine what namespace you want to install Kiali and create it. Give the proper permissions to Kiali. Create the necessary NetworkAttachmentDefinition. Finally, create the Kiali CR that will tell the operator to install Kiali in this new namespace, making sure to add the proper sidecar injection label as explained earlier.
NAMESPACE="kialins"

oc create namespace ${NAMESPACE}

oc adm policy add-scc-to-group privileged system:serviceaccounts:${NAMESPACE}

cat <<EOM | oc apply -f -
apiVersion: k8s.cni.cncf.io/v1
kind: NetworkAttachmentDefinition
metadata:
  name: istio-cni
  namespace: ${NAMESPACE}
EOM

cat <<EOM | oc apply -f -
apiVersion: kiali.io/v1alpha1
kind: Kiali
metadata:
  name: kiali
  namespace: ${NAMESPACE}
spec:
  istio_namespace: istio-system
  auth:
    strategy: anonymous
  deployment:
    accessible_namespaces: [ '**' ]
    pod_labels:
      sidecar.istio.io/inject: "true"
EOM
After the operator installs Kiali, confirm you have two containers in your pod. This indicates your Kiali pod has its proxy sidecar successfully injected.
$ oc get pods -n ${NAMESPACE}
NAME                    READY   STATUS    RESTARTS   AGE
kiali-56bbfd644-nkhlw   2/2     Running   0          43s
6.6 - Istio Component Status
How can I add one component to the list?
If you are interested in adding one more component to the Istio Component Status tooltip, you have the option to add one new component into the
Kiali CR, under the spec.external_services.istio.component_status field.
For each component there, you will need to specify the app label of the deployment’s pods, the namespace and whether is a core component or add-on.
One component is ‘Not found’ but I can see it running. What can I do?
The first thing you should do is check the Kiali CR for the spec.external_services.istio.component_status field (see the reference documentation here)
Kiali looks for a Deployment for which its pods have the app label with the specified value in the CR, and lives in that namespace.
The app label name may be changed from the default (app) and it is specified in the spec.istio_labels.app_label_name in the Kiali CR.
Ensure that you have specified correctly the namespace and that the deployment’s pod template has the specified label.
One component is ‘Unreachable’ but I can see it running. What can I do?
Kiali considers one component as Unreachable when the component responds to a GET request with a 4xx or 5xx response code.
The URL where Kiali sends a GET request to is the same as it is used for the component consumption. However, Kiali allows you to set a specific URL for health check purposes: the health_check_url setting.
In this example, Kiali uses the Prometheus url for both metrics consumption and health checks.
external_services:
  prometheus:
    url: "http://prometheus.istio-system:9090"
In case that the prometheus.url endpoint doesn’t return 2XX/3XX to GET requests, you can use the following settings to specify which health check URL Kiali should use:
external_services:
  prometheus:
    health_check_url: "http://prometheus.istio-system:9090/healthz"
    url: "http://prometheus.istio-system:9090"
Please read the Kiali CR Reference for more information. Each external service component has its own health_check_url and is_core setting to tailor the experience in the Istio Component Status feature.
6.7 - Validations
Which formats does Kiali support for specifying hosts?
Istio highly recommends that you always use fully qualified domain names (FQDN) for hosts in DestinationRules. However, Istio does allow you to use other formats like short names (details or details.bookinfo). Kiali only supports FQDN and simple service names as host formats: for example details.bookinfo.svc.cluster.local or details. Validations using the details.bookinfo format might not be accurate.
In the following example it should show the validation of “More than one Destination Rule for the same host subset combination”. Because of the usage of the short name reviews.bookinfo Kiali won’t show the warning message on both destination rules.
apiVersion: networking.istio.io/v1alpha3
kind: DestinationRule
metadata:
  name: reviews-dr1
spec:
  host: reviews
  trafficPolicy:
    loadBalancer:
      simple: RANDOM
  subsets:
  - name: v1
    labels:
      version: v1
  - name: v2
    labels:
      version: v2
  - name: v3
    labels:
      version: v3
---
apiVersion: networking.istio.io/v1alpha3
kind: DestinationRule
metadata:
  name: reviews-dr2
spec:
  host: reviews
  trafficPolicy:
    loadBalancer:
      simple: RANDOM
  subsets:
  - name: v1
    labels:
      version: v1
See the recomendation Istio gives regarding host format: “To avoid potential misconfigurations, it is recommended to always use fully qualified domain names over short names."
For best results with Kiali, you should use fully qualified domain names when specifying hosts.
7 - Contribution Guidelines
7.1 - How to Contribute
Contributing to the Docs
To contribute to the kiali.io docs see kiali.io on github.
In short you will:
- Fork the kiali.io repo on GitHub.
- Make your changes and send a pull request (PR).
- If you’re not yet ready for a review, add “WIP” to the PR name to indicate it’s a work in progress.
- Don’t add the Hugo property “draft = true” to the page front matter, it prevents auto-deployment of the content preview.
- Wait for the automated PR workflow to do some checks. When it’s ready, you should see a comment like this: deploy/netlify — Deploy preview ready!
- Click Details to the right of “Deploy preview ready” to see a preview of your updates.
- Continue updating your doc and pushing your changes until you’re happy with the content.
Updating a single page
If you’ve just spotted something you’d like to change while using the docs, there is a shortcut for you:
- Click Edit this page in the top right hand corner of the page.
- If you don’t already have an up to date fork of the project repo, you are prompted to get one:
- Click Fork this repository and propose changes or Update your Fork to get an up to date version of the project to edit.
- The appropriate page in your fork is displayed in edit mode.
- Follow the steps above to make, preview, and propose your changes.
Creating an issue
If you’ve found a problem in the docs, but you’re not sure how to fix it yourself, please create an issue in the kiali.io repo. You can also create an issue about a specific page by clicking the Create Documentation Issue button in the top right hand corner of the page.
Contributing to the Code
For code contribution see the kiali project’s CONTRIBUTING page.
7.2 - Development Environment
Introduction
In this section it is explained how to set up a development environment:
- As described in Architecture, we would need to have the Kiali dependencies running in an Openshift or Kubernetes
- We will use a port forward to access those services outside the cluster.
- We will have the project source running locally. In this case we will set up an IDE.
- Bookinfo application example will also be running on our cluster.
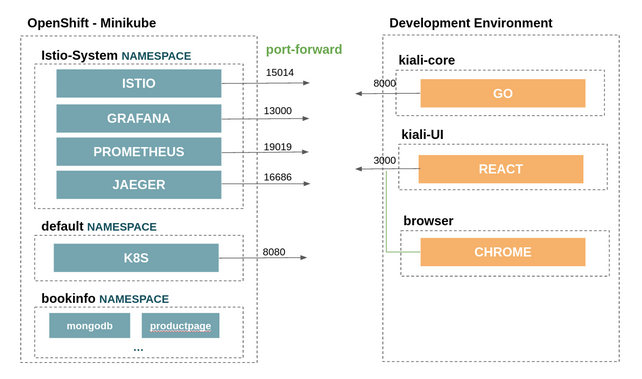
Prerrequisites
- Development tools are installed:
- Istio and required services are running in Minikube or open shift. To install it following the above schema, it is possible to use the following scripts:
hack/istio/install-istio-via-istioctl.sh: Installs the latest Istio release into istio-system namespace along with the Prometheus, Grafana, and Jaeger addons.hack/istio/install-bookinfo-demo.sh: Installs the Bookinfo demo that is found in the Istio release that was installed via the hack/istio/install-istio-via-istioctl.sh hack script.- Pass in
-tgto also install a traffic generator that will send messages periodically into the Bookinfo demo. - If using Minikube and the
-tgoption, make sure you pass in the Minikube profile name via-mpif the profile name is notminikube.
- Pass in
Port forward
Before the setup, we will need to do a port-forward of the services that kiali is using.
We can use the hack/run-kiali.sh script for this purpose. It can work without any options. Pass –help to see the options it takes.
An example to run it following the above schema:
./run-kiali.sh -pg 13000:3000 -pp 19090:9090 -app 8080 -es false -iu http://127.0.0.1:15014
Local Configuration File
The go process will require a configuration to point to these services and other specific configurations. This file will be places in ~/kiali/config.yaml, and referenced later by the GO local process.
api:
  namespaces:
    exclude:
      - istio-operator
      - kube.*
      - openshift.*
      - ibm.*
      - kiali-operator
    label_selector: ""
server:
  address: localhost
  port: 8000
  static_content_root_directory: /home/userTests/kiali-static-files
in_cluster: false
deployment:
  accessible_namespaces: [ "**" ]
extensions:
  iter_8:
    enabled: true
external_services:
  istio:
    istio_canary_revision:
      current: prod
      upgrade: canary
    url_service_version: http://localhost:15014/version
    config_map_name: istio
    istio_identity_domain: svc.cluster.local
  prometheus:
    url: http://localhost:19090
    cache_enabled: true
  tracing:
    enabled: true
    in_cluster_url: http://localhost:16685/jaeger
    url: http://localhost:16686/jaeger
    use_grpc: false
    whitelist_istio_system:
    - jaeger-query
    - istio-ingressgateway
    namespace: istio-system
    port: 443
    service: tracing
    auth:
      insecure_skip_verify: false
      password: cTSM/77tNZ0yGw/ZJXkO7IObbemLJjFkCp4GuqLzXIgE8RWrJvWjFViv9Dpu0SguxD3N/oCUPJnyreoHuSCNZ9kFTrHgRl033waUpTAYZPCEzMPw9Rui5C3/o5x4bclHq0IQ8OGr5LuN2L1WCXrEo9iUntPMovbsP1Alqwh0LZ79ztIkObNBNniX1tuo0fM9O53QKSAjGBnK13LFjHC7wXo+mWw1fzHf9x4jib6UDbeuzHfugDS0Mtj4E9QDRHjpPUrh66dVib4kCJ4nMO19BuiIk+OgbNdhBhg3wn1fn7F6+d/i6Mbq/C/OJylSL6ewUVwIvIAmcRM/jdTqdz0w
      type: basic
      use_kiali_token: false
      username: internal
  grafana:
    in_cluster_url: http://localhost:13000
    url: http://localhost:13000
    dashboards:
      - name: "Istio Service Dashboard"
        variables:
          namespace: "var-namespace"
          service: "var-service"
      - name: "Istio Workload Dashboard"
        variables:
          namespace: "var-namespace"
          workload: "var-workload"
  custom_dashboards:
    enabled: false
#health_config:
#  rate:
#    - namespace: "alpha"
#      tolerance:
#        - code: "4XX"
#          degraded: 30
#          failure: 50
#          protocol: "http"
#        - code: "5XX"
#          degraded: 30
#          failure: 50
#          protocol: "http"
#    - namespace: "beta"
#      tolerance:
#        - code: "[4]\\d\\d"
#          degraded: 30
#          failure: 40
#          protocol: "http"
#        - code: "[5]\\d\\d"
#          protocol: "http"
auth:
  strategy: anonymous
login_token:
  signing_key: test
kubernetes_config:
  cache_enabled: true
  cache_duration: 300
  cache_namespaces:
    - bookinfo
    - istio-system
  cache_token_namespace_duration: 120
  excluded_workloads: []
kiali_feature_flags:
  istio_injection_action: true
  istio_upgrade_action: false
istio_labels:
  app_label_name: app
  injection_label_name: istio-injection
  injection_label_rev: istio.io/rev
  version_label_name: version
Local Processes
In this section we will start the 3 local processes for kiali:
- kiali-core: The backend Go process
- kiali-ui: The frontend React process
- browser: The Javascript debugger process.
We will need to fork the 3 kiali repositories, and then, clone them in a local folder:
In this example, we will create the configurations in the Jetbrains Golang IDE.
kiali-core
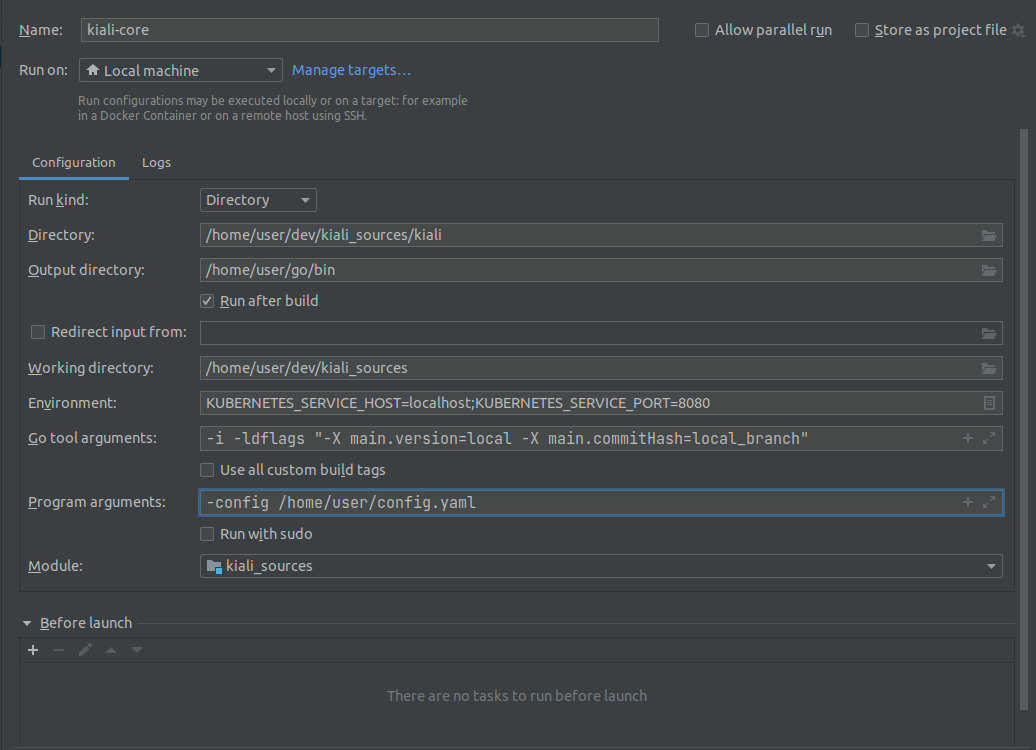
kiali-ui
In order to forward the requests to the backend propertly, we will need to add the following line in kiali/frontend/package.json:
"proxy": "http://localhost:8000",
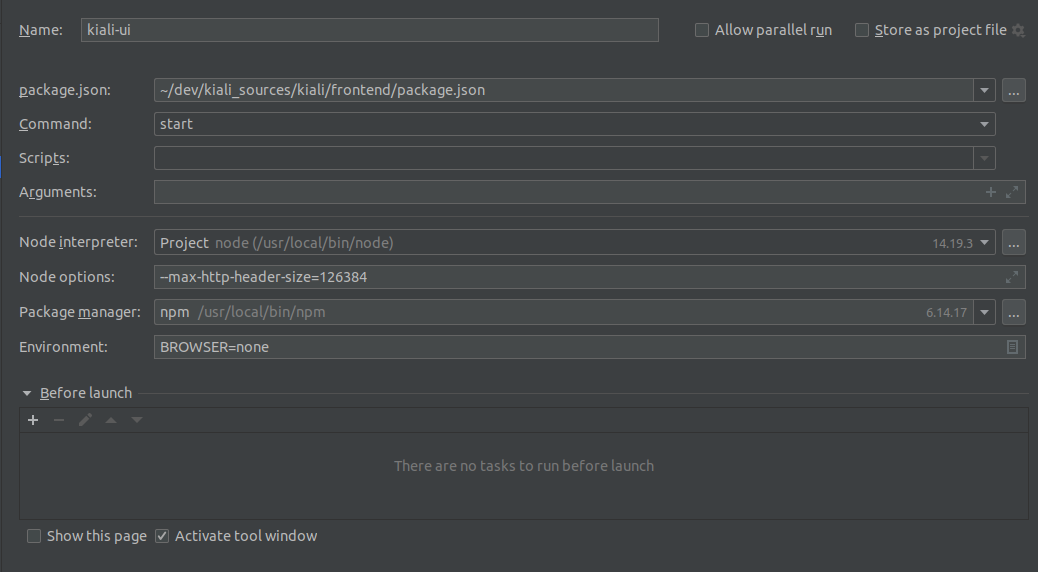
browser
After running the 3 processes, we should be able to access Kiali GUI in localhost:3000
Using VisualStudio Code
To run kiali in a debugger, a file “launch.json” should be created in your local kiali local repo’s .vscode directory (e.g. home/source/kiali/kiali/.vscode/launch.json). The file should look like:
{
  "version": "0.2.0",
  "configurations": [
    {
      "name": "Launch Kiali to use hack script services",
      "type": "go",
      "request": "launch",
      "mode": "debug",
      "program": "${workspaceRoot}/kiali.go",
      "cwd": "${env:HOME}/tmp/run-kiali",
      "args": ["-config", "${env:HOME}/tmp/run-kiali/run-kiali-config.yaml"],
      "env": {
        "KUBERNETES_SERVICE_HOST": "127.0.0.1",
        "KUBERNETES_SERVICE_PORT": "8001",
        "LOG_LEVEL": "trace"
      }
    }
  ]
}
run-kiali.sh should be started like this:
hack/run-kiali.sh --tmp-root-dir $HOME/tmp --enable-server false